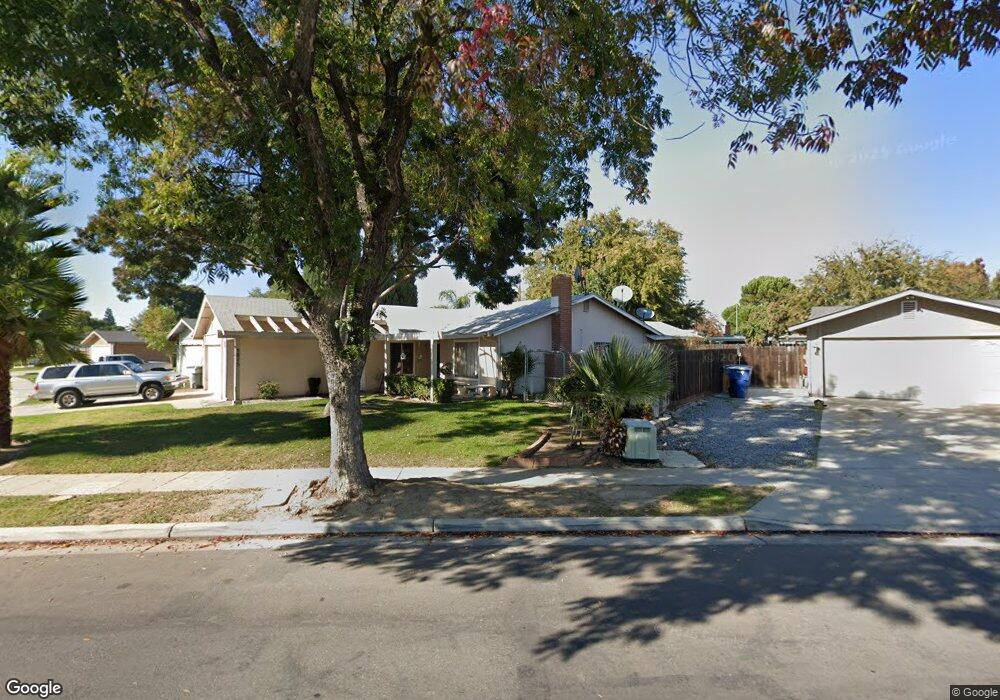
5875 E Dakota Ave Fresno, CA 93727
McLane NeighborhoodEstimated Value: $362,000 - $384,000
3
Beds
2
Baths
1,568
Sq Ft
$238/Sq Ft
Est. Value
About This Home
This home is located at 5875 E Dakota Ave, Fresno, CA 93727 and is currently estimated at $372,447, approximately $237 per square foot. 5875 E Dakota Ave is a home located in Fresno County with nearby schools including Tomahawk School, Miramonte Elementary School, and Reyburn Intermediate School.
Ownership History
Date
Name
Owned For
Owner Type
Purchase Details
Closed on
Oct 23, 2013
Sold by
Whitling Thomas S and Whitling Thomas
Bought by
Whitling Thomas S and Whitling Jimmie Lee
Current Estimated Value
Purchase Details
Closed on
Apr 4, 2011
Sold by
U S Bank National Association
Bought by
Whitling Thomas
Purchase Details
Closed on
Jan 28, 2011
Sold by
Gutierrez Gabriel
Bought by
U S Bank National Association
Purchase Details
Closed on
Oct 31, 2006
Sold by
Mulford James B and Mulford Nancy D
Bought by
Gutierrez Gabriel
Home Financials for this Owner
Home Financials are based on the most recent Mortgage that was taken out on this home.
Original Mortgage
$53,000
Interest Rate
6.28%
Mortgage Type
Stand Alone Second
Create a Home Valuation Report for This Property
The Home Valuation Report is an in-depth analysis detailing your home's value as well as a comparison with similar homes in the area
Home Values in the Area
Average Home Value in this Area
Purchase History
| Date | Buyer | Sale Price | Title Company |
|---|---|---|---|
| Whitling Thomas S | -- | None Available | |
| Whitling Thomas | $82,500 | Lsi Title Company Inc | |
| U S Bank National Association | $136,212 | None Available | |
| Gutierrez Gabriel | $265,000 | Financial Title Company |
Source: Public Records
Mortgage History
| Date | Status | Borrower | Loan Amount |
|---|---|---|---|
| Previous Owner | Gutierrez Gabriel | $53,000 | |
| Previous Owner | Gutierrez Gabriel | $212,000 |
Source: Public Records
Tax History Compared to Growth
Tax History
| Year | Tax Paid | Tax Assessment Tax Assessment Total Assessment is a certain percentage of the fair market value that is determined by local assessors to be the total taxable value of land and additions on the property. | Land | Improvement |
|---|---|---|---|---|
| 2025 | $1,297 | $105,685 | $40,993 | $64,692 |
| 2023 | $1,248 | $101,583 | $39,402 | $62,181 |
| 2022 | $1,232 | $99,592 | $38,630 | $60,962 |
| 2021 | $1,198 | $97,640 | $37,873 | $59,767 |
| 2020 | $1,193 | $96,640 | $37,485 | $59,155 |
| 2019 | $1,170 | $94,746 | $36,750 | $57,996 |
| 2018 | $1,145 | $92,889 | $36,030 | $56,859 |
| 2017 | $1,126 | $91,069 | $35,324 | $55,745 |
| 2016 | $1,089 | $89,284 | $34,632 | $54,652 |
| 2015 | $1,072 | $87,944 | $34,112 | $53,832 |
| 2014 | $1,053 | $86,222 | $33,444 | $52,778 |
Source: Public Records
Map
Nearby Homes
- 5936 E Lansing Way
- 5934 E Dakota Ave
- 3556 N Duke Ave Unit 165
- 3550 N Duke Ave Unit 37
- 3550 N Duke Ave Unit 10
- 3550 N Duke Ave Unit 12
- 3734 Manila Ave
- 3605 Phillip Ave
- 6008 E Sussex Way
- 3322 N Ezie Ave
- 6402 E Millie Dr
- 5965 E Shields Ave Unit 178
- 6157 E Garland Ave
- 5739 E Hampton Way
- 4065 N Eddy Ave
- 5703 E Hampton Way
- 6165 E Farrin Ave
- 1916 Ashlan Ave
- 5675 E Ashlan Ave
- 6083 E Andrews Ave
- 5869 E Dakota Ave
- 5883 E Dakota Ave
- 5872 E Lansing Way
- 5876 E Lansing Way
- 5865 E Dakota Ave
- 5868 E Lansing Way
- 5880 E Lansing Way
- 5880 E Dakota Ave
- 5886 E Dakota Ave
- 3779 N Fordham Ave
- 3813 N Stanford Ave
- 5864 E Lansing Way
- 5857 E Dakota Ave
- 3776 N Fordham Ave
- 3833 N Stanford Ave
- 5892 E Dakota Ave
- 5858 E Lansing Way
- 3769 N Fordham Ave
- 3764 N Fordham Ave
- 5853 E Dakota Ave