Estimated Value: $355,895 - $483,000
3
Beds
2
Baths
3,070
Sq Ft
$135/Sq Ft
Est. Value
About This Home
This home is located at 5875 S Yoder Rd, Yoder, CO 80864 and is currently estimated at $413,474, approximately $134 per square foot. 5875 S Yoder Rd is a home located in El Paso County with nearby schools including Miami/Yoder Elementary School and Miami-Yoder Middle - High School.
Ownership History
Date
Name
Owned For
Owner Type
Purchase Details
Closed on
Sep 7, 2021
Sold by
Dunning Stephen J and Green Dunning Susan
Bought by
Dunning Living Trust
Current Estimated Value
Purchase Details
Closed on
Aug 29, 2014
Sold by
Anderson Kenneth E and Anderson Rozlyn D
Bought by
Dunning Stephen J and Green Dunning Susan
Home Financials for this Owner
Home Financials are based on the most recent Mortgage that was taken out on this home.
Original Mortgage
$140,000
Interest Rate
4.15%
Mortgage Type
New Conventional
Purchase Details
Closed on
Apr 2, 1996
Sold by
Miller Roy T
Bought by
Anderson Kenneth E and Anderson Rozlyn D
Home Financials for this Owner
Home Financials are based on the most recent Mortgage that was taken out on this home.
Original Mortgage
$95,625
Interest Rate
7.35%
Create a Home Valuation Report for This Property
The Home Valuation Report is an in-depth analysis detailing your home's value as well as a comparison with similar homes in the area
Home Values in the Area
Average Home Value in this Area
Purchase History
| Date | Buyer | Sale Price | Title Company |
|---|---|---|---|
| Dunning Living Trust | -- | None Available | |
| Dunning Stephen J | $175,000 | Fidelity National Title Ins | |
| Anderson Kenneth E | $24,000 | -- |
Source: Public Records
Mortgage History
| Date | Status | Borrower | Loan Amount |
|---|---|---|---|
| Previous Owner | Dunning Stephen J | $140,000 | |
| Previous Owner | Anderson Kenneth E | $95,625 |
Source: Public Records
Tax History
| Year | Tax Paid | Tax Assessment Tax Assessment Total Assessment is a certain percentage of the fair market value that is determined by local assessors to be the total taxable value of land and additions on the property. | Land | Improvement |
|---|---|---|---|---|
| 2025 | $722 | $33,190 | -- | -- |
| 2024 | $650 | $22,290 | $4,860 | $17,430 |
| 2023 | $650 | $22,290 | $4,860 | $17,430 |
| 2022 | $740 | $19,170 | $3,480 | $15,690 |
| 2021 | $796 | $19,720 | $3,580 | $16,140 |
| 2020 | $682 | $16,140 | $3,130 | $13,010 |
| 2019 | $694 | $16,140 | $3,130 | $13,010 |
| 2018 | $645 | $14,320 | $2,720 | $11,600 |
| 2017 | $405 | $14,320 | $2,720 | $11,600 |
| 2016 | $391 | $9,050 | $2,860 | $6,190 |
| 2015 | $391 | $9,050 | $2,860 | $6,190 |
| 2014 | $493 | $8,700 | $2,860 | $5,840 |
Source: Public Records
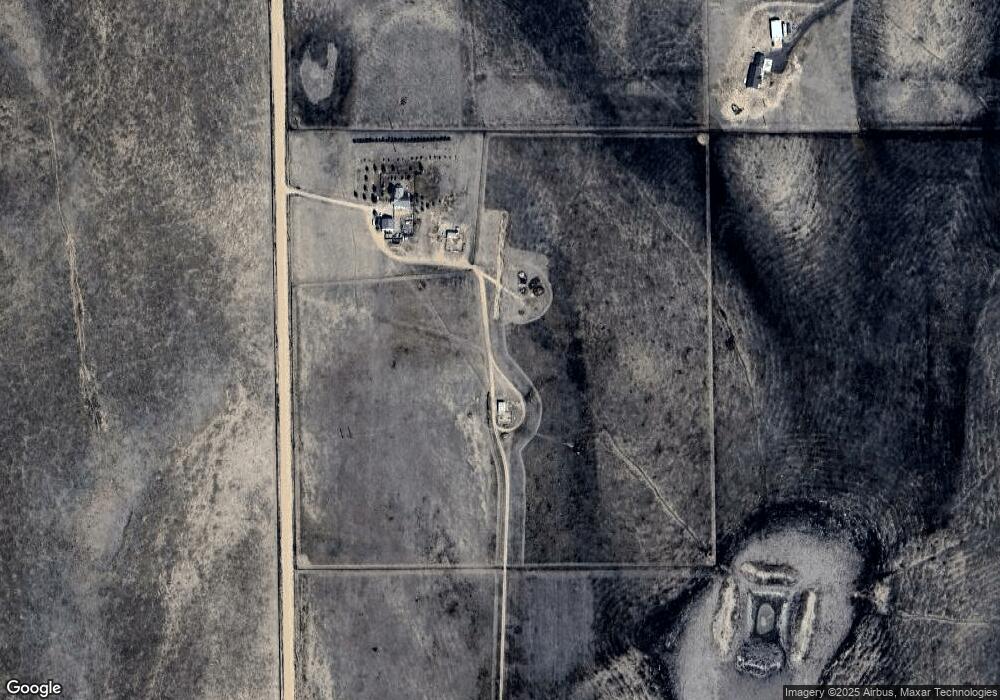
Map
Nearby Homes
- 33455 Fossinger Rd
- 6760 S Yoder Rd
- 5025 Lauppe Rd
- 4875 Lauppe Rd
- 6190 Night Train Ln
- 6325 Night Train Ln
- 32775 Truckton Rd
- 33670 Truckton Rd
- 33550 Truckton Rd
- 7825 Boone Rd
- 8450 Edison Rd
- 28920 Sanborn Rd
- 29424 Sanborn Rd
- 0 Shear Rd
- 37188 Truckton Rd
- 35140 Sanborn Rd
- 0 Equestrian Point
- 35520 Bowen Rd
- 12595 Dan View
- 0 Edison Rd
- 5705 S Yoder Rd
- 0 Yoder Co 80864 Usa Unit 7835572
- 37255 Nad Grove
- 35005 Nad Grove
- 33475 Fossinger Rd
- 32925 Fossinger Rd
- 32705 Truckton Rd
- 32705 Truckton Rd
- 33225 Fossinger Rd
- 33245 Fossinger Rd
- 5434 S Yoder Rd
- 32215 Truckton Rd
- 33430 Truckton Rd
- 33220 Fossinger Rd
- 5274 S Yoder Rd
- 32950 Fossinger Rd
- 33450 Fossinger Rd
- 33510 Fossinger Rd
Your Personal Tour Guide
Ask me questions while you tour the home.