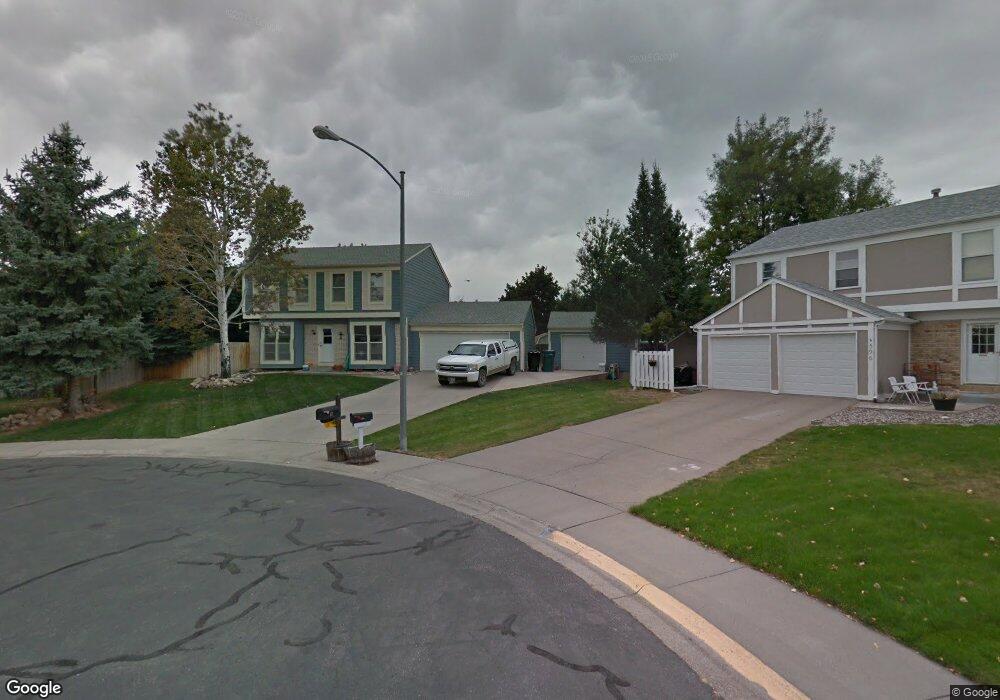
588 Sudan Place Billings, MT 59105
Billings Heights NeighborhoodEstimated Value: $400,000 - $414,000
4
Beds
3
Baths
2,604
Sq Ft
$156/Sq Ft
Est. Value
About This Home
This home is located at 588 Sudan Place, Billings, MT 59105 and is currently estimated at $405,486, approximately $155 per square foot. 588 Sudan Place is a home located in Yellowstone County with nearby schools including Alkali Creek School, Castle Rock Junior High School, and Skyview High School.
Ownership History
Date
Name
Owned For
Owner Type
Purchase Details
Closed on
Sep 23, 2022
Sold by
Gene Mcbee Jr Billy
Bought by
Kosche Thomas and Kosche Ruth
Current Estimated Value
Home Financials for this Owner
Home Financials are based on the most recent Mortgage that was taken out on this home.
Original Mortgage
$379,441
Interest Rate
5.22%
Mortgage Type
Construction
Purchase Details
Closed on
Aug 5, 2013
Sold by
Mcbee Billy and Mcbee Jane
Bought by
Mcbee Billy Gene and Mcbee Teresa G
Home Financials for this Owner
Home Financials are based on the most recent Mortgage that was taken out on this home.
Original Mortgage
$90,000
Interest Rate
3.92%
Mortgage Type
Credit Line Revolving
Purchase Details
Closed on
May 8, 2012
Sold by
Benedict Craig
Bought by
Mcbee Billy Gene
Purchase Details
Closed on
May 13, 2010
Sold by
Burrows Michelle and Benedict Michelle
Bought by
Benedict Craig
Create a Home Valuation Report for This Property
The Home Valuation Report is an in-depth analysis detailing your home's value as well as a comparison with similar homes in the area
Home Values in the Area
Average Home Value in this Area
Purchase History
| Date | Buyer | Sale Price | Title Company |
|---|---|---|---|
| Kosche Thomas | -- | First Montana Title Company | |
| Mcbee Billy Gene | -- | Chicago Title | |
| Mcbee Billy Gene | -- | Chicago Title | |
| Benedict Craig | -- | None Available |
Source: Public Records
Mortgage History
| Date | Status | Borrower | Loan Amount |
|---|---|---|---|
| Closed | Kosche Thomas | $379,441 | |
| Previous Owner | Mcbee Billy Gene | $90,000 |
Source: Public Records
Tax History Compared to Growth
Tax History
| Year | Tax Paid | Tax Assessment Tax Assessment Total Assessment is a certain percentage of the fair market value that is determined by local assessors to be the total taxable value of land and additions on the property. | Land | Improvement |
|---|---|---|---|---|
| 2025 | $3,611 | $373,900 | $64,000 | $309,900 |
| 2024 | $3,611 | $359,800 | $65,110 | $294,690 |
| 2023 | $3,615 | $359,800 | $65,110 | $294,690 |
| 2022 | $2,316 | $245,300 | $0 | $0 |
| 2021 | $2,721 | $245,300 | $0 | $0 |
| 2020 | $2,797 | $242,100 | $0 | $0 |
| 2019 | $2,678 | $242,100 | $0 | $0 |
| 2018 | $2,591 | $229,600 | $0 | $0 |
| 2017 | $2,521 | $229,600 | $0 | $0 |
| 2016 | $2,252 | $205,000 | $0 | $0 |
| 2015 | $2,206 | $215,100 | $0 | $0 |
| 2014 | $2,080 | $102,396 | $0 | $0 |
Source: Public Records
Map
Nearby Homes
- 518 Pyramid Place
- 325 Sahara Dr
- 372 Tabriz Dr
- 502 Poppy Place
- 739 Bazaar Exchange
- 844 Governors Blvd
- 153 W Hilltop Rd
- TBD Antelope Place
- 521 Indian Trail
- 605 Sahara Dr
- 636 Antelope Cir Unit 5
- 740 Topaz Ave
- 11 Antelope Trail
- 324 Stewart Ct N
- 522 E Alkali Creek Rd
- NKN Antelope
- 317 Moccasin Trail
- 307 Moccasin Trail
- 2027 Gleneagles Blvd
- 2011 Gleneagles Blvd
- 596 Sudan Place
- 621 Mecca Dr
- 580 Sudan Place
- 597 Sudan Place
- 393 Caravan Ave
- 645 Mecca Dr
- 589 Sudan Place
- 583 Sudan Place
- 630 Aronson Ave
- 644 Aronson Ave
- 624 Aronson Ave
- 632 Mecca Dr
- 654 Aronson Ave
- 644 Mecca Dr
- 618 Aronson Ave
- 386 Caravan Ave
- 409 Caravan Ave
- 398 Caravan Ave
- 652 Mecca Dr
- 339 Caravan Ave