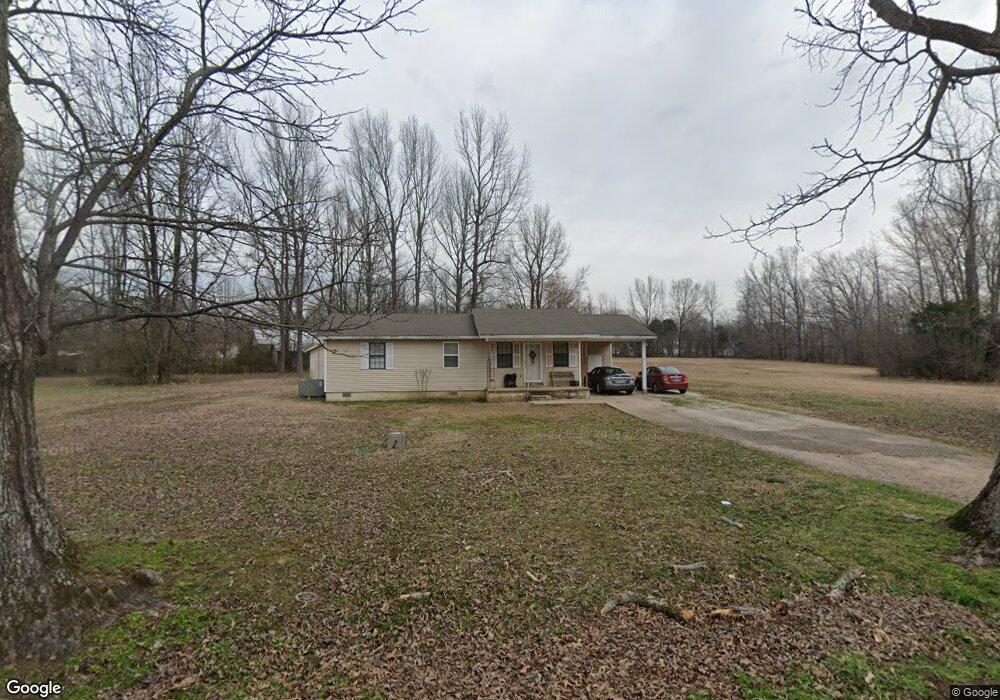
589 Airways Blvd Savannah, TN 38372
Estimated Value: $101,717 - $166,000
--
Bed
2
Baths
1,044
Sq Ft
$128/Sq Ft
Est. Value
About This Home
This home is located at 589 Airways Blvd, Savannah, TN 38372 and is currently estimated at $133,429, approximately $127 per square foot. 589 Airways Blvd is a home located in Hardin County with nearby schools including Hardin County High School and Hardin County Christian School.
Ownership History
Date
Name
Owned For
Owner Type
Purchase Details
Closed on
Dec 9, 2024
Sold by
Lewis Virginia A and Hindman Virginia
Bought by
Lewis Virginia A
Current Estimated Value
Home Financials for this Owner
Home Financials are based on the most recent Mortgage that was taken out on this home.
Original Mortgage
$80,719
Outstanding Balance
$80,084
Interest Rate
6.79%
Mortgage Type
Credit Line Revolving
Estimated Equity
$53,345
Purchase Details
Closed on
May 6, 1988
Bought by
Hindman Virginia
Purchase Details
Closed on
Jul 23, 1985
Bought by
Jennings Keith and Jennings Tammy
Create a Home Valuation Report for This Property
The Home Valuation Report is an in-depth analysis detailing your home's value as well as a comparison with similar homes in the area
Home Values in the Area
Average Home Value in this Area
Purchase History
| Date | Buyer | Sale Price | Title Company |
|---|---|---|---|
| Lewis Virginia A | -- | Titlemax | |
| Hindman Virginia | $32,000 | -- | |
| Jennings Keith | -- | -- |
Source: Public Records
Mortgage History
| Date | Status | Borrower | Loan Amount |
|---|---|---|---|
| Open | Lewis Virginia A | $80,719 |
Source: Public Records
Tax History Compared to Growth
Tax History
| Year | Tax Paid | Tax Assessment Tax Assessment Total Assessment is a certain percentage of the fair market value that is determined by local assessors to be the total taxable value of land and additions on the property. | Land | Improvement |
|---|---|---|---|---|
| 2024 | $468 | $19,075 | $2,025 | $17,050 |
| 2023 | $468 | $19,075 | $2,025 | $17,050 |
| 2022 | $354 | $12,800 | $2,025 | $10,775 |
| 2021 | $354 | $12,800 | $2,025 | $10,775 |
| 2020 | $354 | $12,800 | $2,025 | $10,775 |
| 2019 | $354 | $12,800 | $2,025 | $10,775 |
| 2018 | $345 | $12,800 | $2,025 | $10,775 |
| 2017 | $378 | $13,600 | $2,050 | $11,550 |
| 2016 | $378 | $13,600 | $2,050 | $11,550 |
| 2015 | $343 | $13,600 | $2,050 | $11,550 |
| 2014 | $333 | $13,225 | $2,050 | $11,175 |
Source: Public Records
Map
Nearby Homes