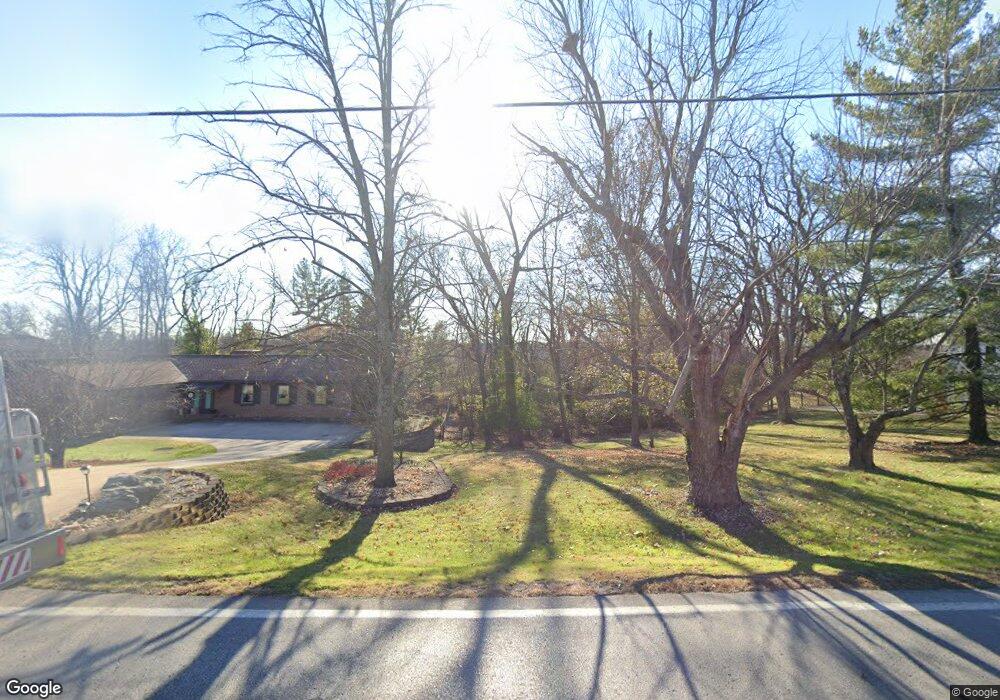
5893 W Fork Rd Cincinnati, OH 45247
Estimated Value: $713,000 - $1,001,000
4
Beds
4
Baths
3,805
Sq Ft
$222/Sq Ft
Est. Value
About This Home
This home is located at 5893 W Fork Rd, Cincinnati, OH 45247 and is currently estimated at $845,565, approximately $222 per square foot. 5893 W Fork Rd is a home located in Hamilton County with nearby schools including Monfort Heights Elementary School, White Oak Middle School, and Colerain High School.
Ownership History
Date
Name
Owned For
Owner Type
Purchase Details
Closed on
Aug 30, 2019
Sold by
Trimble Steven G and Trimble Paula M
Bought by
Hardig Lisa and Hardig Gregory C
Current Estimated Value
Home Financials for this Owner
Home Financials are based on the most recent Mortgage that was taken out on this home.
Original Mortgage
$484,350
Outstanding Balance
$421,428
Interest Rate
3.7%
Mortgage Type
New Conventional
Estimated Equity
$424,137
Purchase Details
Closed on
Jul 13, 2007
Sold by
Murphy Mary Beth
Bought by
Trimble Steven G and Trimble Paula M
Home Financials for this Owner
Home Financials are based on the most recent Mortgage that was taken out on this home.
Original Mortgage
$520,000
Interest Rate
6.42%
Mortgage Type
Negative Amortization
Purchase Details
Closed on
Dec 22, 2005
Sold by
Murphy Michael C
Bought by
Murphy Mary Beth
Create a Home Valuation Report for This Property
The Home Valuation Report is an in-depth analysis detailing your home's value as well as a comparison with similar homes in the area
Home Values in the Area
Average Home Value in this Area
Purchase History
| Date | Buyer | Sale Price | Title Company |
|---|---|---|---|
| Hardig Lisa | $615,000 | None Available | |
| Trimble Steven G | $650,000 | Attorney | |
| Murphy Mary Beth | -- | None Available |
Source: Public Records
Mortgage History
| Date | Status | Borrower | Loan Amount |
|---|---|---|---|
| Open | Hardig Lisa | $484,350 | |
| Previous Owner | Trimble Steven G | $520,000 |
Source: Public Records
Tax History
| Year | Tax Paid | Tax Assessment Tax Assessment Total Assessment is a certain percentage of the fair market value that is determined by local assessors to be the total taxable value of land and additions on the property. | Land | Improvement |
|---|---|---|---|---|
| 2025 | $13,477 | $248,234 | $38,052 | $210,182 |
| 2023 | $13,251 | $248,234 | $38,052 | $210,182 |
| 2022 | $14,061 | $215,250 | $39,956 | $175,294 |
| 2021 | $12,916 | $215,250 | $39,956 | $175,294 |
| 2020 | $13,010 | $215,250 | $39,956 | $175,294 |
| 2019 | $11,949 | $178,857 | $38,052 | $140,805 |
| 2018 | $10,644 | $178,857 | $38,052 | $140,805 |
| 2017 | $10,077 | $178,857 | $38,052 | $140,805 |
| 2016 | $9,183 | $160,182 | $37,678 | $122,504 |
| 2015 | $9,248 | $160,182 | $37,678 | $122,504 |
| 2014 | $9,266 | $160,182 | $37,678 | $122,504 |
| 2013 | $8,755 | $161,802 | $38,059 | $123,743 |
Source: Public Records
Map
Nearby Homes
- Site 1 Brierly Creek Rd
- 5804 Cedaridge Dr
- 6051 Shelrich Ct
- 5563 Haft Rd
- 5876 Sutters Mill Dr
- 5442 Bluesky Dr
- 5588 W Fork Rd
- 5221 Clearlake Dr
- 5182 Michael Anthony Ln
- 5339 Race Rd
- 6670 Gaines Rd
- 5104 Jonkard Ln
- 5547 Hubble Rd
- 5073 Valley Ridge Rd
- 5207 S Eaglesnest Dr
- 6586 Hearne Rd Unit 2T
- 5080 Jessup Rd
- 5705 Blackwolf Run
- 6989 Carlinridge Ln
- 6617 Hearne Rd
- 6028 Eden Roc Place
- 6032 Eden Roc Place
- 5905 W Fork Rd
- 5905 W Fork Rd
- 5925 W Fork Rd
- 6024 Eden Roc Place
- 6040 Eden Roc Place
- 5881 W Fork Rd
- 5945 W Fork Rd
- 5891 W Fork Rd
- 6017 W Fork Rd
- 6039 Eden Roc Place
- 5756 Gaines Rd
- 5896 W Fork Rd
- 6023 Eden Roc Place
- 5886 W Fork Rd
- 5766 Gaines Rd
- 5969 W Fork Rd
- 5924 W Fork Rd
- 5878 W Fork Rd
Your Personal Tour Guide
Ask me questions while you tour the home.