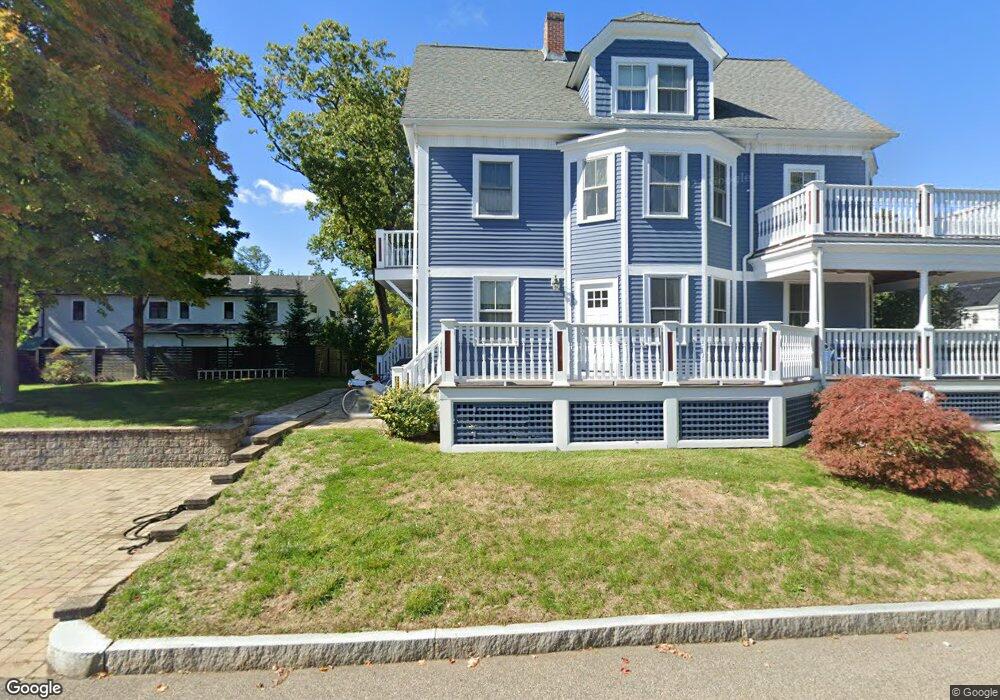
59 Cornell St Unit 61 Newton Lower Falls, MA 02462
Newton Lower Falls NeighborhoodEstimated Value: $1,447,672 - $1,468,000
1
Bed
1
Bath
1,000
Sq Ft
$1,458/Sq Ft
Est. Value
About This Home
This home is located at 59 Cornell St Unit 61, Newton Lower Falls, MA 02462 and is currently estimated at $1,457,836, approximately $1,457 per square foot. 59 Cornell St Unit 61 is a home located in Middlesex County with nearby schools including Angier Elementary School, Charles E Brown Middle School, and Newton South High School.
Ownership History
Date
Name
Owned For
Owner Type
Purchase Details
Closed on
Jun 12, 2007
Sold by
Paris Jonathan B
Bought by
Paris Jonathan B and Paris Lauren R
Current Estimated Value
Home Financials for this Owner
Home Financials are based on the most recent Mortgage that was taken out on this home.
Original Mortgage
$927,499
Outstanding Balance
$530,094
Interest Rate
5%
Mortgage Type
Purchase Money Mortgage
Estimated Equity
$927,742
Purchase Details
Closed on
Jun 3, 2005
Sold by
C&C Rt and Palli George C
Bought by
Paris Jonathan B
Create a Home Valuation Report for This Property
The Home Valuation Report is an in-depth analysis detailing your home's value as well as a comparison with similar homes in the area
Home Values in the Area
Average Home Value in this Area
Purchase History
| Date | Buyer | Sale Price | Title Company |
|---|---|---|---|
| Paris Jonathan B | -- | -- | |
| Paris Jonathan B | $300,000 | -- |
Source: Public Records
Mortgage History
| Date | Status | Borrower | Loan Amount |
|---|---|---|---|
| Open | Paris Jonathan B | $927,499 |
Source: Public Records
Tax History Compared to Growth
Tax History
| Year | Tax Paid | Tax Assessment Tax Assessment Total Assessment is a certain percentage of the fair market value that is determined by local assessors to be the total taxable value of land and additions on the property. | Land | Improvement |
|---|---|---|---|---|
| 2025 | $11,785 | $1,202,500 | $795,800 | $406,700 |
| 2024 | $11,395 | $1,167,500 | $772,600 | $394,900 |
| 2023 | $10,841 | $1,064,900 | $638,500 | $426,400 |
| 2022 | $10,373 | $986,000 | $591,200 | $394,800 |
| 2021 | $9,733 | $904,600 | $542,400 | $362,200 |
| 2020 | $9,444 | $904,600 | $542,400 | $362,200 |
| 2019 | $8,834 | $845,400 | $506,900 | $338,500 |
| 2018 | $8,801 | $813,400 | $471,200 | $342,200 |
| 2017 | $8,298 | $746,200 | $432,300 | $313,900 |
| 2016 | $7,791 | $684,600 | $396,600 | $288,000 |
| 2015 | $7,428 | $639,800 | $370,700 | $269,100 |
Source: Public Records
Map
Nearby Homes
- 25 Columbia St
- 45 Moulton St
- 17 Deforest Rd
- 7 Crescent St
- 2084 Washington St
- 45 E Quinobequin Rd
- 8 Old Town Rd
- 2 Longfellow Rd
- 34 Palmer Rd
- 12 Bird Hill Ave
- 135 Orchard Ave
- 41 Orchard Ave
- 27 Oakwood Rd
- 177 Varick Rd
- 20 Oakland Street Front
- 10 Lorraine Cir
- 54 Colburn Rd
- 17 Lasell St
- 52 Valley Rd
- 33 Metacomet Rd