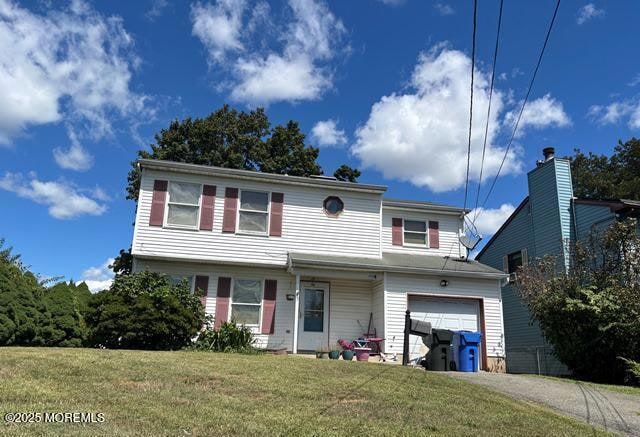
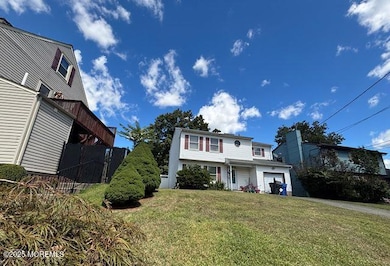
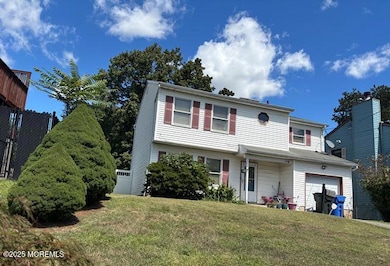
59 E New St Sewaren, NJ 07077
Estimated payment $3,557/month
Highlights
- Colonial Architecture
- 1 Car Attached Garage
- 2-minute walk to Herbert Rankin Park
- No HOA
- Cooling Available
About This Home
DO NOT DISTURB OCCUPANTS -SOLD OCCUPIED- Property is being sold as-is and occupied; interior access is not available. Buyer responsible for all due diligence. Drive-by only do not disturb occupants. Property sold as-is, Purchaser responsible for CO
Home Details
Home Type
- Single Family
Est. Annual Taxes
- $11,180
Year Built
- Built in 1992
Lot Details
- 5,663 Sq Ft Lot
- Lot Dimensions are 55 x 100
Parking
- 1 Car Attached Garage
Home Design
- Colonial Architecture
- Shingle Roof
Interior Spaces
- 1,548 Sq Ft Home
- 2-Story Property
Bedrooms and Bathrooms
- 3 Bedrooms
Schools
- Woodbridge Middle School
Utilities
- Cooling Available
Community Details
- No Home Owners Association
Listing and Financial Details
- Assessor Parcel Number 25-00748-02-00033-02
Map
Home Values in the Area
Average Home Value in this Area
Tax History
| Year | Tax Paid | Tax Assessment Tax Assessment Total Assessment is a certain percentage of the fair market value that is determined by local assessors to be the total taxable value of land and additions on the property. | Land | Improvement |
|---|---|---|---|---|
| 2025 | $11,180 | $82,600 | $17,000 | $65,600 |
| 2024 | $10,903 | $82,600 | $17,000 | $65,600 |
| 2023 | $10,903 | $82,600 | $17,000 | $65,600 |
| 2022 | $10,239 | $82,600 | $17,000 | $65,600 |
| 2021 | $10,133 | $82,600 | $17,000 | $65,600 |
| 2020 | $9,800 | $82,600 | $17,000 | $65,600 |
| 2019 | $9,551 | $82,600 | $17,000 | $65,600 |
| 2018 | $9,300 | $82,600 | $17,000 | $65,600 |
| 2017 | $9,112 | $82,600 | $17,000 | $65,600 |
| 2016 | $9,026 | $82,600 | $17,000 | $65,600 |
| 2015 | $8,848 | $82,600 | $17,000 | $65,600 |
| 2014 | $8,637 | $82,600 | $17,000 | $65,600 |
Property History
| Date | Event | Price | List to Sale | Price per Sq Ft |
|---|---|---|---|---|
| 09/04/2025 09/04/25 | For Sale | $510,000 | -- | $329 / Sq Ft |
Purchase History
| Date | Type | Sale Price | Title Company |
|---|---|---|---|
| Sheriffs Deed | $424,764 | None Listed On Document | |
| Sheriffs Deed | $424,764 | None Listed On Document | |
| Deed | -- | -- | |
| Deed | $295,740 | -- |
Mortgage History
| Date | Status | Loan Amount | Loan Type |
|---|---|---|---|
| Previous Owner | $280,950 | Purchase Money Mortgage |
Source: MOREMLS (Monmouth Ocean Regional REALTORS®)
MLS Number: 22526837
APN: 25-00748-02-00033-02
Disclaimer: Certain information contained herein is derived from information provided by parties other than Homes.com. All information provided is deemed reliable, but is not guaranteed to be accurate and should be independently verified.
![]() IDX information is provided exclusively for personal, non-commercial use, and may not be used for any purpose other than to identify prospective properties consumers may be interested in purchasing.
IDX information is provided exclusively for personal, non-commercial use, and may not be used for any purpose other than to identify prospective properties consumers may be interested in purchasing.
Information is deemed reliable but not guaranteed.
- 391 East Ave
- 88 Woodbridge Ave
- 121 Woodbridge Ave
- 140 S Robert St
- 36 Vernon St
- 193 Old Rd
- 28 Debra Place
- 15 Rector Ave
- 15 Rector Ave Unit 2
- 135 Crampton Ave
- 271 Woodbridge Ave
- 74 Albert St
- 60 Crampton Ave
- 78 Spring St
- 29 Claire Ave
- 46 Melbourne Ct
- 24 4th Ave
- 361 Garretson Ave
- 279 Amboy Ave
- 0 Winant Place
- 354 Cliff Rd Unit 2
- 472 Cliff Rd Unit 3
- 55 Cutters Dock Rd Unit B
- 75 Fulton St
- 121 S Fulton St
- 159 Fulton St Unit 2
- 159 Fulton St Unit 3
- 27 Rector Ave
- 254 Woodbridge Ave Unit 1
- 133 Harriot St
- 1210 Cricket Ln
- 74 Coley St
- 1125 Convery Blvd
- 54 Main St Unit A
- 474 Rahway Ave Unit 6
- 315 E Smith St
- 55 Brook St
- 331 Cricket Ln Unit 331A
- 10 E Green St
- 96 Main St Unit 2L

Ask me questions while you tour the home.