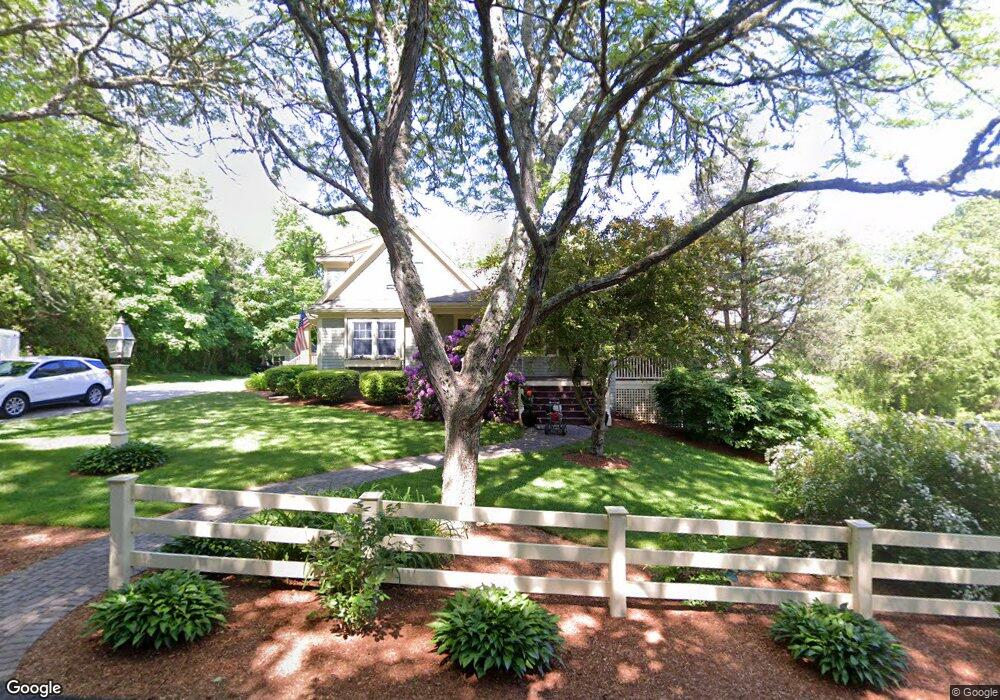
59 Locust Ave West Barnstable, MA 02668
West Barnstable NeighborhoodEstimated Value: $817,000 - $977,000
3
Beds
2
Baths
1,501
Sq Ft
$605/Sq Ft
Est. Value
About This Home
This home is located at 59 Locust Ave, West Barnstable, MA 02668 and is currently estimated at $908,586, approximately $605 per square foot. 59 Locust Ave is a home located in Barnstable County with nearby schools including West Barnstable Elementary School, Barnstable United Elementary School, and Barnstable Intermediate School.
Ownership History
Date
Name
Owned For
Owner Type
Purchase Details
Closed on
Sep 22, 2008
Sold by
Hagberg Clifford and Hagberg Janice L
Bought by
Riley Judith A
Current Estimated Value
Home Financials for this Owner
Home Financials are based on the most recent Mortgage that was taken out on this home.
Original Mortgage
$324,000
Outstanding Balance
$215,711
Interest Rate
6.54%
Mortgage Type
Purchase Money Mortgage
Estimated Equity
$692,875
Purchase Details
Closed on
Jan 7, 2000
Sold by
Howland Kenneth B and Howland Sharron K
Bought by
Hagberg Clifford
Home Financials for this Owner
Home Financials are based on the most recent Mortgage that was taken out on this home.
Original Mortgage
$224,000
Interest Rate
7.73%
Mortgage Type
Purchase Money Mortgage
Create a Home Valuation Report for This Property
The Home Valuation Report is an in-depth analysis detailing your home's value as well as a comparison with similar homes in the area
Home Values in the Area
Average Home Value in this Area
Purchase History
| Date | Buyer | Sale Price | Title Company |
|---|---|---|---|
| Riley Judith A | $405,000 | -- | |
| Hagberg Clifford | $280,000 | -- |
Source: Public Records
Mortgage History
| Date | Status | Borrower | Loan Amount |
|---|---|---|---|
| Open | Hagberg Clifford | $100,000 | |
| Open | Riley Judith A | $324,000 | |
| Previous Owner | Hagberg Clifford | $226,000 | |
| Previous Owner | Hagberg Clifford | $224,000 |
Source: Public Records
Tax History
| Year | Tax Paid | Tax Assessment Tax Assessment Total Assessment is a certain percentage of the fair market value that is determined by local assessors to be the total taxable value of land and additions on the property. | Land | Improvement |
|---|---|---|---|---|
| 2025 | $7,572 | $810,700 | $219,200 | $591,500 |
| 2024 | $6,503 | $757,900 | $219,200 | $538,700 |
| 2023 | $6,417 | $704,400 | $218,200 | $486,200 |
| 2022 | $6,347 | $571,300 | $159,600 | $411,700 |
| 2021 | $2,258 | $514,000 | $159,600 | $354,400 |
| 2020 | $2,145 | $478,700 | $159,600 | $319,100 |
| 2019 | $5,530 | $450,300 | $159,600 | $290,700 |
| 2018 | $5,314 | $428,900 | $175,100 | $253,800 |
| 2017 | $5,122 | $418,500 | $175,100 | $243,400 |
| 2016 | $5,018 | $418,500 | $175,100 | $243,400 |
| 2015 | $5,064 | $423,400 | $167,400 | $256,000 |
Source: Public Records
Map
Nearby Homes
Your Personal Tour Guide
Ask me questions while you tour the home.