
59 Mansfield St Unit 61 Hartford, CT 06112
North End NeighborhoodEstimated payment $1,307/month
Total Views
35,786
9
Beds
3
Baths
3,888
Sq Ft
$59
Price per Sq Ft
Highlights
- Hot Property
- Attic
- Hot Water Circulator
- Property is near public transit
- Public Transportation
- Hot Water Heating System
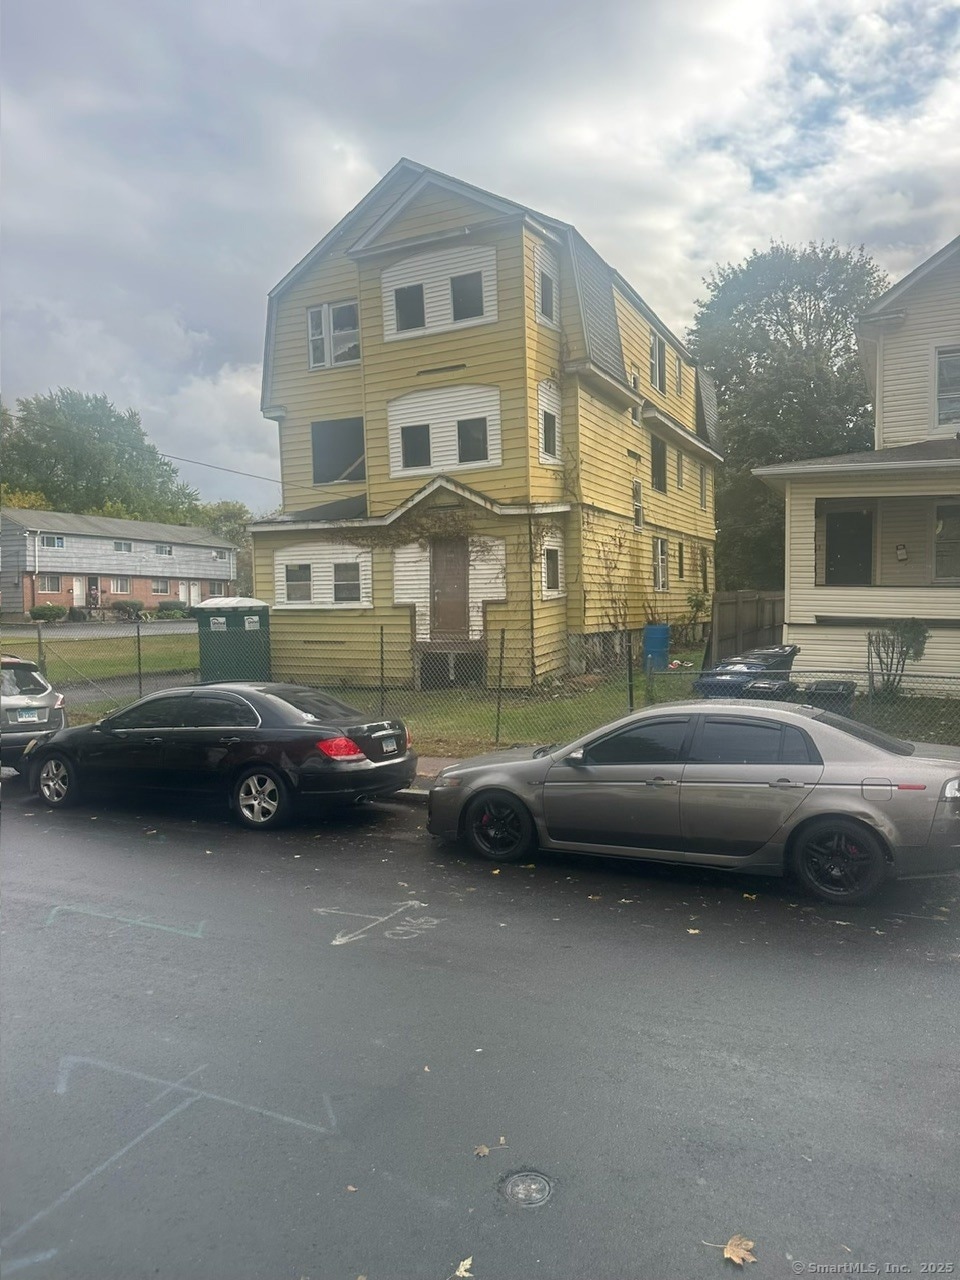
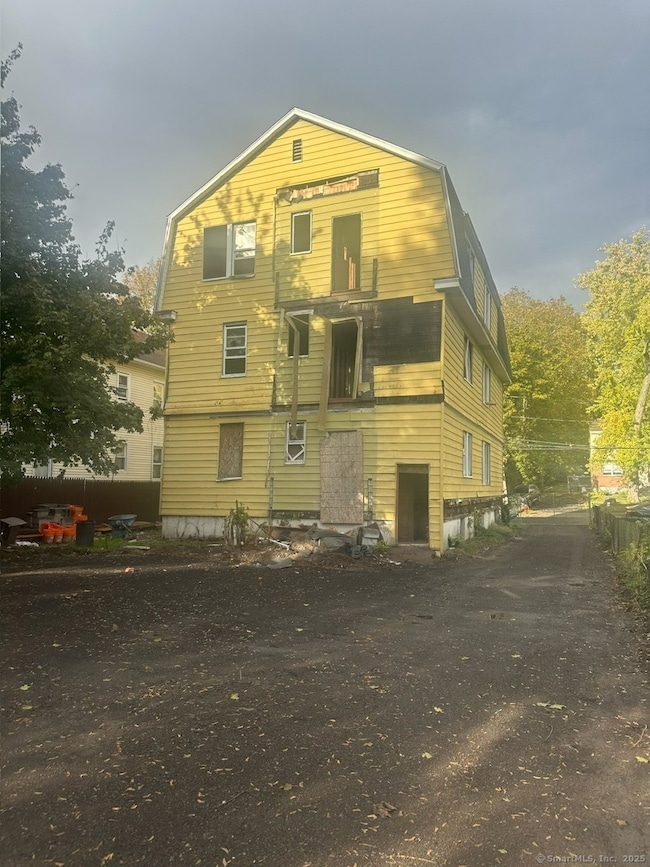
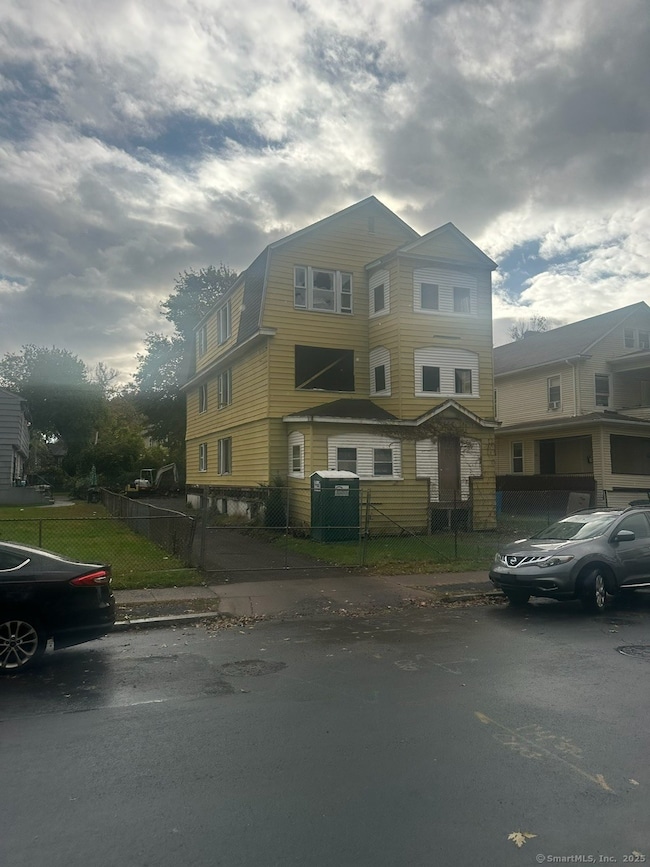
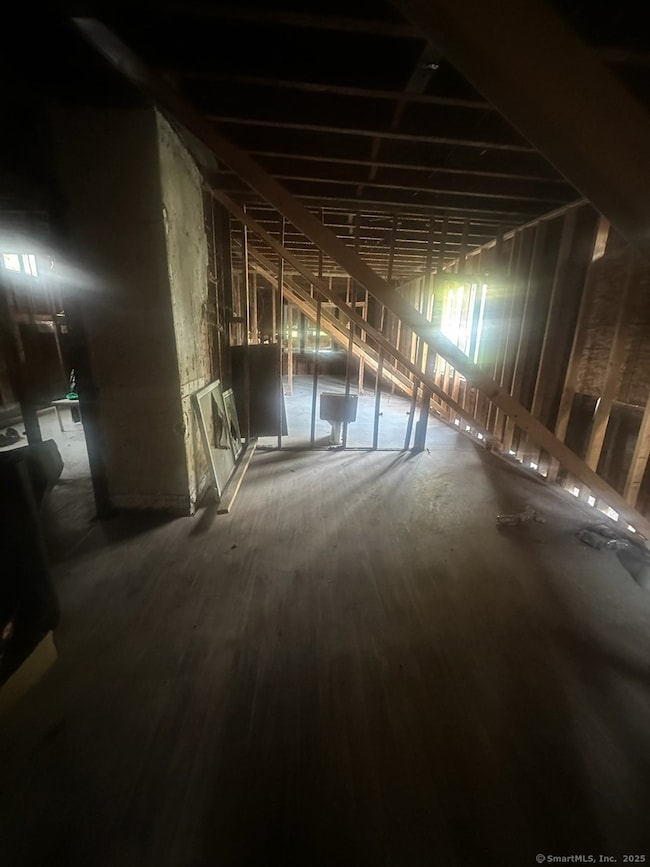
About This Home
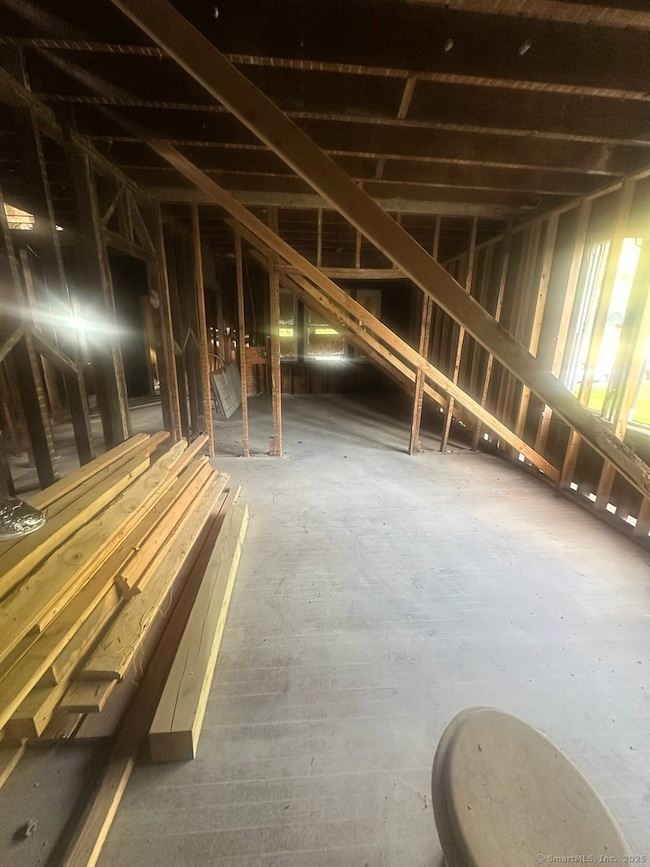
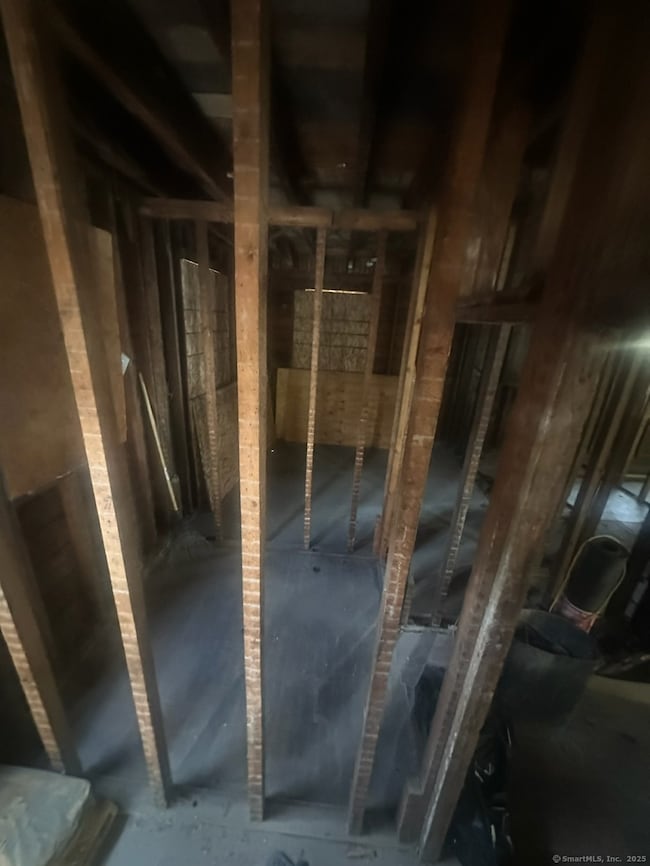
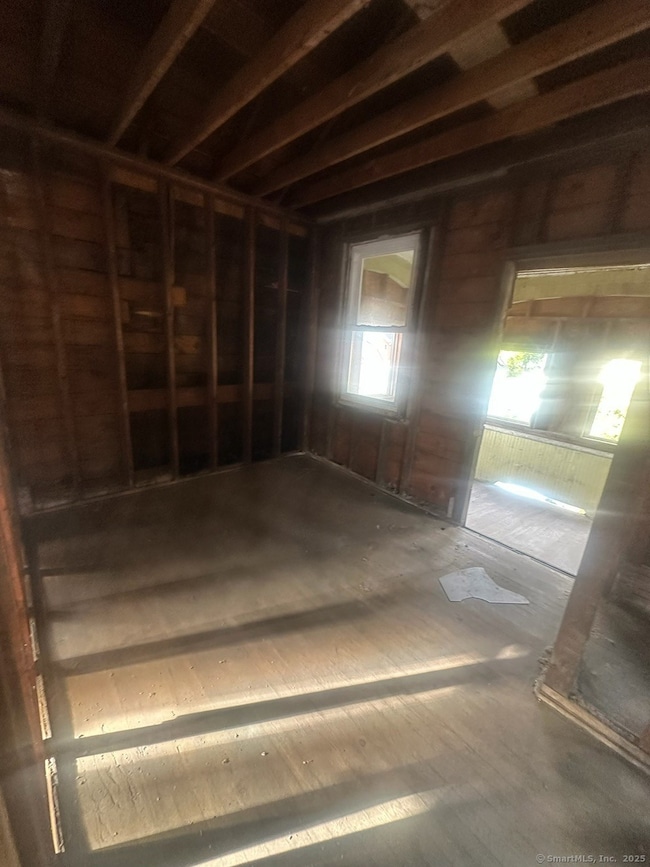
This fully gutted 3-family property has been taken down to the studs and is ready for your vision. The heavy lifting has already been completed now it's your opportunity to design, rebuild, and transform this multi-family into exactly what today's market demands. With a brand-new foundation (final photo and city certificate coming soon), a new driveway, and all interiors opened up, this home offers a true blank canvas for the owner-occupant or investor. Located close to schools, parks, shopping, and major highways, the property offers strong rental potential and long-term demand. Utilities, layout, and finishes can be configured to modern standards, allowing you to maximize efficiency, value, and return on investment.This is a rare chance to create a fully renovated 3-family home tailored to today's market.* Asking Price: $265,000* Estimated Repairs: ~$150,000 * ARV: $500,000-$525,000* Tax Incentive: 10-year program available* All permits will be closed prior to closing. Bring your plans and imagination this one is ready for transformation.
Listing Agent
Five Stars Realty Brokerage Phone: (860) 573-0277 License #RES.0821174 Listed on: 11/11/2025
Co-Listing Agent
Five Stars Realty Brokerage Phone: (860) 573-0277 License #RES.0828984
Property Details
Home Type
- Multi-Family
Est. Annual Taxes
- $1,219
Year Built
- Built in 1924
Lot Details
- 9,148 Sq Ft Lot
- Level Lot
Home Design
- Concrete Foundation
- Frame Construction
- Asphalt Shingled Roof
- Vinyl Siding
Interior Spaces
- 3,888 Sq Ft Home
- Unfinished Basement
- Basement Fills Entire Space Under The House
- Attic or Crawl Hatchway Insulated
Bedrooms and Bathrooms
- 9 Bedrooms
- 3 Full Bathrooms
Parking
- 6 Parking Spaces
- Private Driveway
Location
- Property is near public transit
- Property is near a bus stop
Utilities
- Hot Water Heating System
- Heating System Uses Natural Gas
- Hot Water Circulator
- No Hot Water
Community Details
- 3 Units
- Public Transportation
Listing and Financial Details
- Assessor Parcel Number 608843
Map
Create a Home Valuation Report for This Property
The Home Valuation Report is an in-depth analysis detailing your home's value as well as a comparison with similar homes in the area
Home Values in the Area
Average Home Value in this Area
Tax History
| Year | Tax Paid | Tax Assessment Tax Assessment Total Assessment is a certain percentage of the fair market value that is determined by local assessors to be the total taxable value of land and additions on the property. | Land | Improvement |
|---|---|---|---|---|
| 2025 | $1,219 | $17,677 | $4,594 | $13,083 |
| 2024 | $1,219 | $17,677 | $4,594 | $13,083 |
| 2023 | $1,219 | $17,677 | $4,594 | $13,083 |
| 2022 | $1,219 | $17,677 | $4,594 | $13,083 |
| 2021 | $837 | $11,270 | $4,025 | $7,245 |
| 2020 | $837 | $11,270 | $4,025 | $7,245 |
| 2019 | $837 | $11,270 | $4,025 | $7,245 |
| 2018 | $3,306 | $44,507 | $3,889 | $40,618 |
| 2016 | $3,446 | $46,382 | $3,704 | $42,678 |
| 2015 | $3,282 | $44,179 | $3,528 | $40,651 |
| 2014 | $3,202 | $43,099 | $3,442 | $39,657 |
Source: Public Records
Property History
| Date | Event | Price | List to Sale | Price per Sq Ft |
|---|---|---|---|---|
| 12/07/2025 12/07/25 | For Sale | $229,925 | 0.0% | $59 / Sq Ft |
| 11/17/2025 11/17/25 | Pending | -- | -- | -- |
| 11/11/2025 11/11/25 | For Sale | $229,925 | -- | $59 / Sq Ft |
Source: SmartMLS
Purchase History
| Date | Type | Sale Price | Title Company |
|---|---|---|---|
| Quit Claim Deed | -- | None Available | |
| Quit Claim Deed | -- | None Available | |
| Quit Claim Deed | -- | -- | |
| Quit Claim Deed | -- | -- | |
| Deed | $27,501 | -- | |
| Deed | $27,501 | -- |
Source: Public Records
Mortgage History
| Date | Status | Loan Amount | Loan Type |
|---|---|---|---|
| Open | $342,000 | Commercial | |
| Closed | $342,000 | Commercial | |
| Previous Owner | $23,165 | Unknown | |
| Previous Owner | $42,840 | Commercial |
Source: Public Records
About the Listing Agent
I'm an expert real estate agent with Five stars realty Hartford CT and the nearby area, providing home-buyers and sellers with professional, responsive and attentive real estate services. Want an agent who'll really listen to what you want in a home? Need an agent who knows how to effectively market your home so it sells? Give me a call! I'm eager to help and would love to talk to you.
Jason's Other Listings
Source: SmartMLS
MLS Number: 24139522
APN: HTFD-000219-000211-000093
Disclaimer: Certain information contained herein is derived from information provided by parties other than Homes.com. All information provided is deemed reliable, but is not guaranteed to be accurate and should be independently verified.
![]() IDX information is provided exclusively for personal, non-commercial use, and may not be used for any purpose other than to identify prospective properties consumers may be interested in purchasing. Information is deemed reliable but not guaranteed.
IDX information is provided exclusively for personal, non-commercial use, and may not be used for any purpose other than to identify prospective properties consumers may be interested in purchasing. Information is deemed reliable but not guaranteed.
Nearby Homes
- 50 Mansfield St
- 33 E Raymond St Unit 35
- 87 Mansfield St Unit 89
- 147 Enfield St Unit 149
- 551 Garden St Unit 553
- 67 Enfield St Unit 37
- 141 Greenfield St
- 238 Enfield St Unit 240
- 171 Edgewood St Unit 173
- 183 Brook St Unit 185
- 134 Magnolia St Unit 136
- 186 Brook St Unit 188
- 410 Garden St
- 152 Brook St
- 275 Westland St
- 4 Deerfield Ave
- 158 Martin St Unit 160
- 25 Judson St Unit C
- 39 Capen St
- 62 Burton St
- 526 Garden St Unit 2N
- 204 Magnolia St Unit 3S
- 204 Magnolia St Unit 2
- 424 Edgewood St Unit 1
- 308 Edgewood St Unit 1
- 37 Martin St
- 195 Edgewood St Unit 2
- 79 Barbour St Unit N3
- 79 Barbour St Unit S1
- 79 Barbour St Unit N2
- 79 Barbour St Unit S3
- 79 Barbour St Unit S2
- 79 Barbour St Unit N1
- 352 Vine St Unit 2nd Floor
- 33 Guilford St Unit B
- 213 Westland St
- 45 Mahl Ave Unit 47
- 190 Westland St Unit 192
- 5 Winter St Unit 3
- 87 Mather St