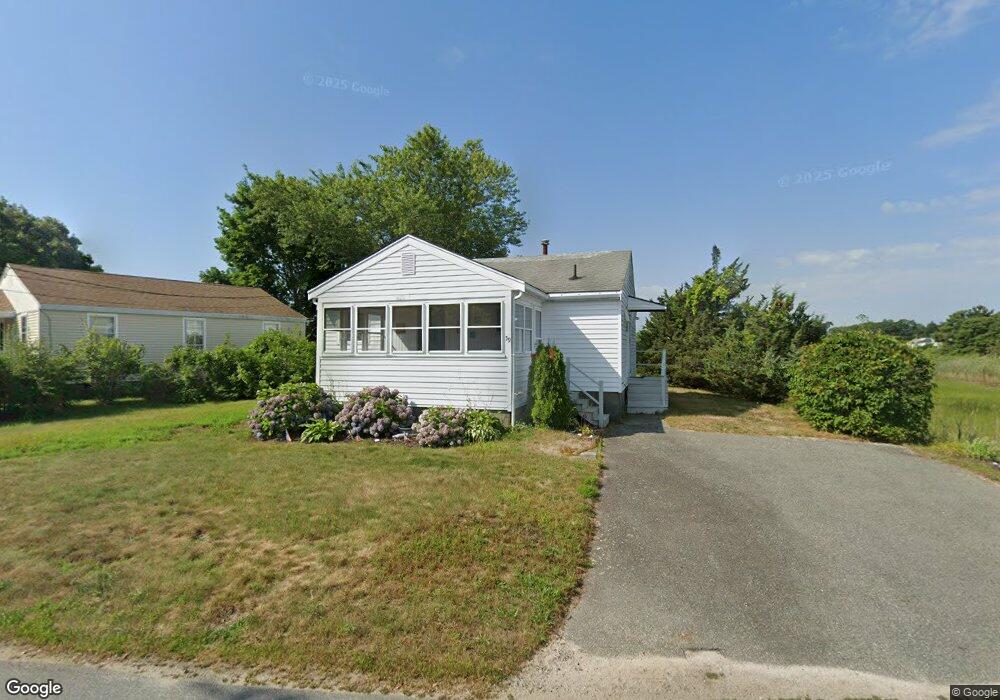
59 Pilgrim Ave Wareham, MA 02571
Wareham Center NeighborhoodEstimated Value: $393,096 - $426,000
2
Beds
1
Bath
780
Sq Ft
$523/Sq Ft
Est. Value
About This Home
This home is located at 59 Pilgrim Ave, Wareham, MA 02571 and is currently estimated at $407,774, approximately $522 per square foot. 59 Pilgrim Ave is a home located in Plymouth County.
Ownership History
Date
Name
Owned For
Owner Type
Purchase Details
Closed on
Feb 9, 2022
Sold by
Degennaro David M
Bought by
Degennard Ft and Degennaro
Current Estimated Value
Purchase Details
Closed on
Aug 29, 2018
Sold by
Degennaro Brianna I
Bought by
Degennaro David M
Create a Home Valuation Report for This Property
The Home Valuation Report is an in-depth analysis detailing your home's value as well as a comparison with similar homes in the area
Home Values in the Area
Average Home Value in this Area
Purchase History
| Date | Buyer | Sale Price | Title Company |
|---|---|---|---|
| Degennard Ft | -- | None Available | |
| Degennard Ft | -- | None Available | |
| Degennaro David M | $26,666 | -- | |
| Degennaro David M | $26,666 | -- | |
| Degennaro David M | $26,666 | -- | |
| Degennaro David M | $26,666 | -- | |
| Degennaro David M | $26,666 | -- | |
| Degennaro David M | $26,666 | -- | |
| Degennaro David M | $80,000 | -- | |
| Degennaro David M | $80,000 | -- |
Source: Public Records
Tax History
| Year | Tax Paid | Tax Assessment Tax Assessment Total Assessment is a certain percentage of the fair market value that is determined by local assessors to be the total taxable value of land and additions on the property. | Land | Improvement |
|---|---|---|---|---|
| 2025 | $4,202 | $403,300 | $207,200 | $196,100 |
| 2024 | $4,090 | $364,200 | $159,600 | $204,600 |
| 2023 | $3,721 | $325,200 | $145,200 | $180,000 |
| 2022 | $3,721 | $282,300 | $145,200 | $137,100 |
| 2021 | $3,539 | $263,100 | $145,200 | $117,900 |
| 2020 | $3,389 | $255,600 | $145,200 | $110,400 |
| 2019 | $3,233 | $243,300 | $144,000 | $99,300 |
| 2018 | $3,194 | $234,300 | $144,000 | $90,300 |
| 2017 | $3,025 | $224,900 | $144,000 | $80,900 |
| 2016 | $3,065 | $226,500 | $156,900 | $69,600 |
| 2015 | $2,704 | $206,900 | $137,300 | $69,600 |
| 2014 | $2,283 | $177,700 | $105,200 | $72,500 |
Source: Public Records
Map
Nearby Homes
- 6 Allen Ave
- 15 Broadmarsh Ave
- 43 Shore Ave
- 20 Grant St
- 6 Pine St
- 106 Circuit Ave
- 6 Wildwood Ave
- 21 Bayview St
- 10 Barnes St
- 4 Mather Dr
- 3 Cranberry Grove Way Unit C
- 3 Hazel St
- 10 Oak St
- 0 Cromesett Rd (Off) Unit 73385395
- 6 Bourne Terrace
- 55 Minot Ave Unit 55
- 233 Marion Rd
- 4 Roosevelt St
- 9 Woodville Way
- 437 Main St
Your Personal Tour Guide
Ask me questions while you tour the home.