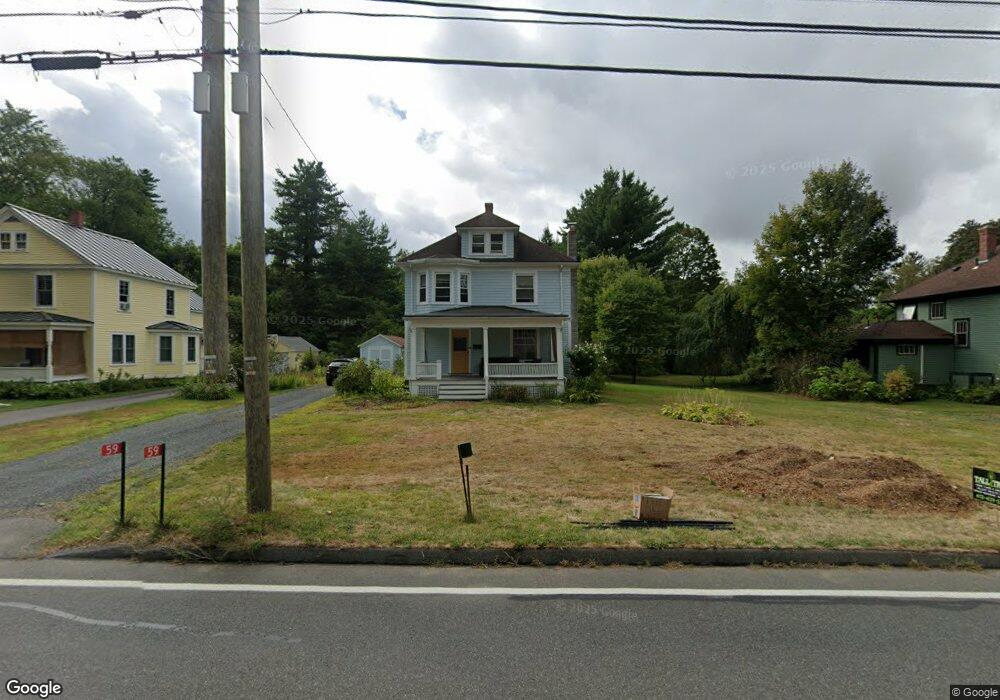
59 Pine St Amherst, MA 01002
Estimated Value: $464,316 - $643,000
4
Beds
2
Baths
1,848
Sq Ft
$286/Sq Ft
Est. Value
About This Home
This home is located at 59 Pine St, Amherst, MA 01002 and is currently estimated at $528,329, approximately $285 per square foot. 59 Pine St is a home located in Hampshire County with nearby schools including Wildwood Elementary School, Amherst Regional Middle School, and Amherst Regional High School.
Ownership History
Date
Name
Owned For
Owner Type
Purchase Details
Closed on
Aug 27, 1997
Sold by
Floyd Deborah J and Weinstein Alan M
Bought by
Churchill Andrew M and Churchill Jacqueline C
Current Estimated Value
Create a Home Valuation Report for This Property
The Home Valuation Report is an in-depth analysis detailing your home's value as well as a comparison with similar homes in the area
Home Values in the Area
Average Home Value in this Area
Purchase History
We collect this data history from publicly available records. To have your information removed, we recommend requesting removal directly through your county’s website.
| Date | Buyer | Sale Price | Title Company |
|---|---|---|---|
| Churchill Andrew M | $168,000 | -- |
Source: Public Records
Mortgage History
We collect this data history from publicly available records. To have your information removed, we recommend requesting removal directly through your county’s website.
| Date | Status | Borrower | Loan Amount |
|---|---|---|---|
| Open | Churchill Andrew M | $153,500 | |
| Closed | Churchill Andrew M | $173,000 | |
| Closed | Churchill Andrew M | $172,000 | |
| Closed | Churchill Andrew M | $10,000 |
Source: Public Records
Tax History
| Year | Tax Paid | Tax Assessment Tax Assessment Total Assessment is a certain percentage of the fair market value that is determined by local assessors to be the total taxable value of land and additions on the property. | Land | Improvement |
|---|---|---|---|---|
| 2025 | $75 | $417,100 | $159,200 | $257,900 |
| 2024 | $7,289 | $393,800 | $150,200 | $243,600 |
| 2023 | $6,945 | $345,500 | $136,600 | $208,900 |
| 2022 | $6,549 | $307,900 | $124,200 | $183,700 |
| 2021 | $4,518 | $286,200 | $115,000 | $171,200 |
| 2020 | $6,102 | $286,200 | $115,000 | $171,200 |
| 2019 | $3,996 | $271,800 | $115,000 | $156,800 |
| 2018 | $5,746 | $271,800 | $115,000 | $156,800 |
| 2017 | $5,776 | $264,600 | $109,600 | $155,000 |
| 2016 | $5,615 | $264,600 | $109,600 | $155,000 |
| 2015 | $5,435 | $264,600 | $109,600 | $155,000 |
Source: Public Records
Map
Nearby Homes
- 208 Pine St Unit 53
- 87 Harlow Dr
- 274 Sunderland Rd
- 691 E Pleasant St
- 185 Cherry Ln
- 20 Bridge St
- 390 State St
- Lot A Kingman Rd
- 281 Leverett Rd
- 50 Mount Pleasant
- 471 Flat Hills Rd
- 12 Pleasant Ct
- 8 Teawaddle Hill Rd
- 305 Strong St
- 16 Old Long Plain Rd
- 0 Red Gate Ln Unit 73348273
- 139 Gray St
- 242 N East St Unit 24
- 222 N East St Unit 1
- 32 N Prospect St Unit 4
Your Personal Tour Guide
Ask me questions while you tour the home.