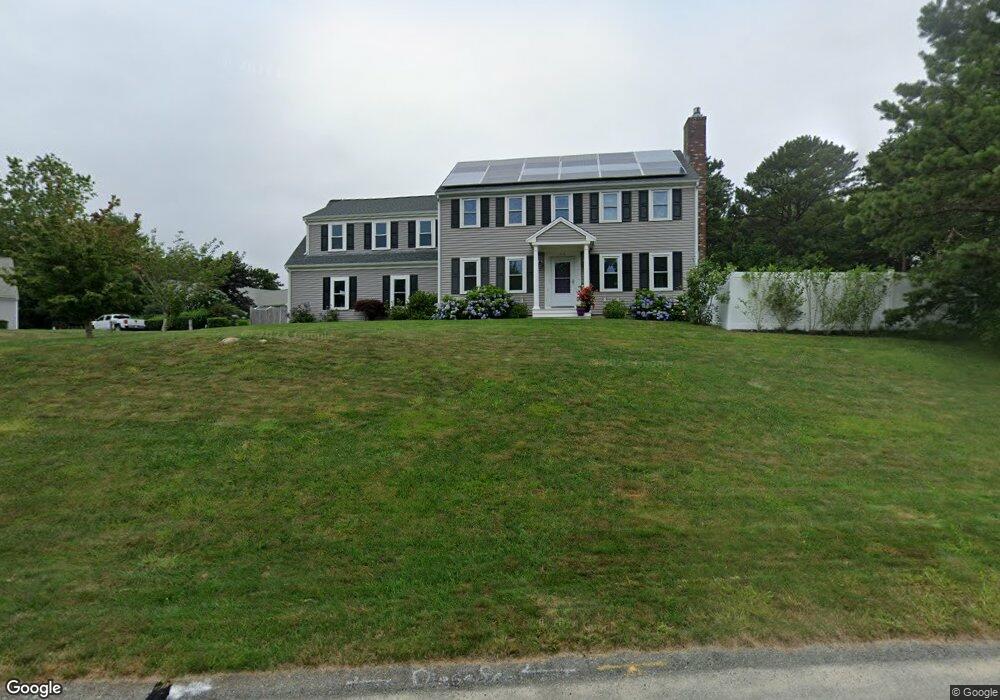
59 Spinnaker Ln Pocasset, MA 02559
Pocasset NeighborhoodEstimated Value: $752,000 - $817,000
3
Beds
2
Baths
1,688
Sq Ft
$468/Sq Ft
Est. Value
About This Home
This home is located at 59 Spinnaker Ln, Pocasset, MA 02559 and is currently estimated at $789,416, approximately $467 per square foot. 59 Spinnaker Ln is a home located in Barnstable County with nearby schools including Bourne High School.
Ownership History
Date
Name
Owned For
Owner Type
Purchase Details
Closed on
Nov 18, 2014
Sold by
Carpenito Nt and Carpenito
Bought by
Carpenito Frank and Strode Ann M
Current Estimated Value
Purchase Details
Closed on
Mar 19, 2008
Sold by
Farrell Susan M and Farrell William J
Bought by
Howarth Elizabeth A and Carpenito Frank R
Purchase Details
Closed on
Jul 24, 2003
Sold by
Demis Lisa A
Bought by
Farrell William J and Farrell Susan M
Purchase Details
Closed on
May 15, 2001
Sold by
Bowers James D and Davern Emily A
Bought by
Demis Lisa A
Purchase Details
Closed on
Jan 28, 2000
Sold by
Powers Michael S
Bought by
Bowers James D and Davern Emily A
Purchase Details
Closed on
Feb 27, 1998
Sold by
Bankers Trust Co Ca
Bought by
Powers Michael S
Purchase Details
Closed on
Aug 26, 1997
Sold by
Bryden William G
Bought by
Bankers Trust Co Ca
Purchase Details
Closed on
Dec 29, 1994
Sold by
Pocasset Woods Rt and Priestly Donald H
Bought by
Bryden William G
Create a Home Valuation Report for This Property
The Home Valuation Report is an in-depth analysis detailing your home's value as well as a comparison with similar homes in the area
Home Values in the Area
Average Home Value in this Area
Purchase History
| Date | Buyer | Sale Price | Title Company |
|---|---|---|---|
| Carpenito Frank | -- | -- | |
| Carpenito Frank | -- | -- | |
| Howarth Elizabeth A | $345,000 | -- | |
| Howarth Elizabeth A | $345,000 | -- | |
| Farrell William J | $325,000 | -- | |
| Farrell William J | $325,000 | -- | |
| Demis Lisa A | $237,500 | -- | |
| Demis Lisa A | $237,500 | -- | |
| Bowers James D | $182,100 | -- | |
| Bowers James D | $182,100 | -- | |
| Powers Michael S | $133,900 | -- | |
| Powers Michael S | $133,900 | -- | |
| Bankers Trust Co Ca | $123,667 | -- | |
| Bankers Trust Co Ca | $123,667 | -- | |
| Bryden William G | $144,700 | -- | |
| Bryden William G | $144,700 | -- |
Source: Public Records
Mortgage History
| Date | Status | Borrower | Loan Amount |
|---|---|---|---|
| Previous Owner | Bryden William G | $338,003 |
Source: Public Records
Tax History
| Year | Tax Paid | Tax Assessment Tax Assessment Total Assessment is a certain percentage of the fair market value that is determined by local assessors to be the total taxable value of land and additions on the property. | Land | Improvement |
|---|---|---|---|---|
| 2025 | $6,006 | $769,000 | $198,500 | $570,500 |
| 2024 | $5,874 | $732,400 | $189,100 | $543,300 |
| 2023 | $5,711 | $648,200 | $167,300 | $480,900 |
| 2022 | $3,809 | $377,500 | $148,100 | $229,400 |
| 2021 | $3,423 | $317,800 | $134,800 | $183,000 |
| 2020 | $3,337 | $310,700 | $133,500 | $177,200 |
| 2019 | $3,160 | $300,700 | $133,500 | $167,200 |
| 2018 | $3,040 | $288,400 | $127,200 | $161,200 |
| 2017 | $2,921 | $283,600 | $125,900 | $157,700 |
| 2016 | $2,780 | $273,600 | $119,700 | $153,900 |
| 2015 | $2,755 | $273,600 | $119,700 | $153,900 |
Source: Public Records
Map
Nearby Homes
- 20 Colony Ave
- 3 1st St
- 4 Harbor Hill Dr
- 7 4th Ave
- 3 4th Ave
- 709 County Rd
- 16 Amberwood Ct
- 254 Barlows Landing Rd
- 566 Shore Rd
- 16 Michael Rd
- 12 Turnberry Rd Unit 12
- 203 County Rd
- 4 Hollyhock Knoll Ct Unit 4
- 4 Hollyhock Knoll Ct Unit 4
- 14 Navajo Rd
- 5 Sea Knoll Ct
- 13 Laurel Hill Ct
- 5 Zoli Ln
- 44 Cotuit Rd
- 10 Sandy Ln
- 81 Spinnaker Ln
- 61 Spinnaker Ln
- 86 Spinnaker Ln
- 84 Spinnaker Ln
- 82 Spinnaker Ln
- 79 Spinnaker Ln
- 57 Spinnaker Ln
- 63 Spinnaker Ln
- 63 Spinnaker Ln Unit 2
- 75 Spinnaker Ln
- 80 Spinnaker Ln
- 73 Spinnaker Ln
- 55 Spinnaker Ln
- 2 Daniel Webster Rd
- 2 Daniel Webster Ln
- 65 Spinnaker Ln
- 1 Daniel Webster Ln
- 1 Daniel Webster Rd
- 8 Daniel Webster Rd
- 78 Spinnaker Ln
Your Personal Tour Guide
Ask me questions while you tour the home.