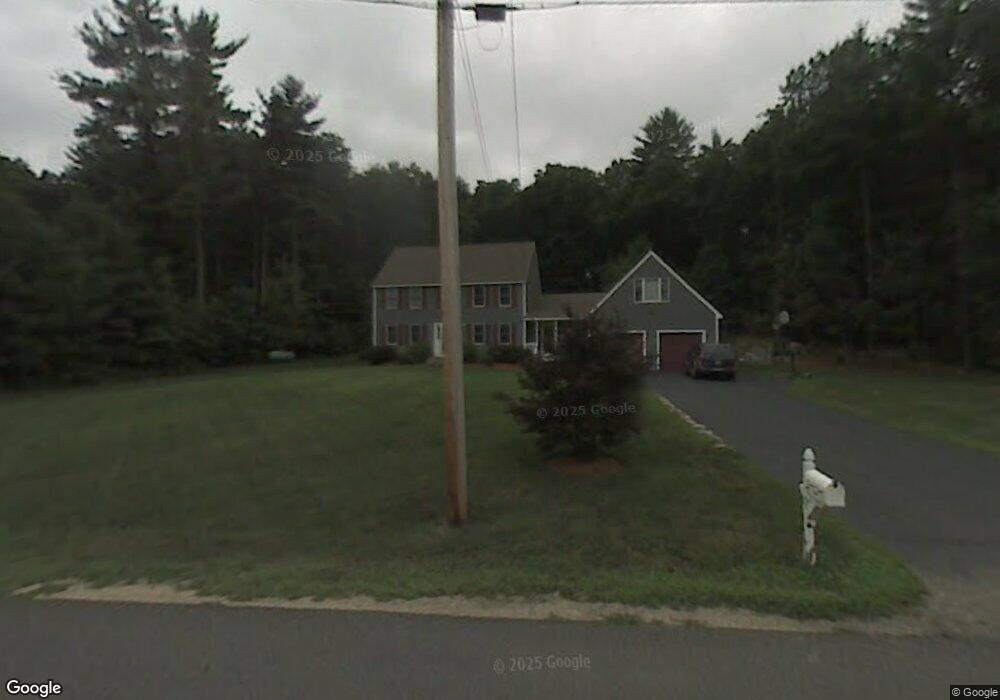
59 Westfall Rd Pelham, NH 03076
Estimated Value: $693,000 - $853,000
3
Beds
2
Baths
2,815
Sq Ft
$273/Sq Ft
Est. Value
About This Home
This home is located at 59 Westfall Rd, Pelham, NH 03076 and is currently estimated at $767,976, approximately $272 per square foot. 59 Westfall Rd is a home with nearby schools including Pelham Elementary School, Pelham Memorial School, and Pelham High School.
Ownership History
Date
Name
Owned For
Owner Type
Purchase Details
Closed on
Jun 6, 2018
Sold by
Duffy John and Duffy Kimberly A
Bought by
Duffy Ft and Duffy
Current Estimated Value
Purchase Details
Closed on
Feb 29, 2000
Sold by
Wenetta John
Bought by
Duffy John and Duffy Kimberly A
Home Financials for this Owner
Home Financials are based on the most recent Mortgage that was taken out on this home.
Original Mortgage
$158,000
Interest Rate
8.15%
Mortgage Type
Purchase Money Mortgage
Create a Home Valuation Report for This Property
The Home Valuation Report is an in-depth analysis detailing your home's value as well as a comparison with similar homes in the area
Home Values in the Area
Average Home Value in this Area
Purchase History
We collect this data history from publicly available records. To have your information removed, we recommend requesting removal directly through your county’s website.
| Date | Buyer | Sale Price | Title Company |
|---|---|---|---|
| Duffy Ft | -- | -- | |
| Duffy John | $235,000 | -- |
Source: Public Records
Mortgage History
We collect this data history from publicly available records. To have your information removed, we recommend requesting removal directly through your county’s website.
| Date | Status | Borrower | Loan Amount |
|---|---|---|---|
| Previous Owner | Duffy John | $158,000 |
Source: Public Records
Tax History
| Year | Tax Paid | Tax Assessment Tax Assessment Total Assessment is a certain percentage of the fair market value that is determined by local assessors to be the total taxable value of land and additions on the property. | Land | Improvement |
|---|---|---|---|---|
| 2025 | $11,233 | $588,400 | $170,900 | $417,500 |
| 2024 | $10,791 | $588,400 | $170,900 | $417,500 |
| 2023 | $10,703 | $588,400 | $170,900 | $417,500 |
| 2022 | $10,250 | $588,400 | $170,900 | $417,500 |
| 2021 | $9,391 | $588,400 | $170,900 | $417,500 |
| 2020 | $8,494 | $420,500 | $136,800 | $283,700 |
| 2019 | $8,158 | $420,500 | $136,800 | $283,700 |
| 2018 | $8,204 | $382,300 | $136,800 | $245,500 |
| 2017 | $8,200 | $382,300 | $136,800 | $245,500 |
| 2016 | $8,009 | $382,300 | $136,800 | $245,500 |
| 2015 | $7,848 | $337,400 | $130,500 | $206,900 |
| 2014 | $7,716 | $337,400 | $130,500 | $206,900 |
| 2013 | $7,721 | $337,600 | $130,500 | $207,100 |
Source: Public Records
Map
Nearby Homes
- 190 Wyndridge Cir
- 4 Jennifer Dr
- 6 Wilshire Ln Unit 6
- 136 Wyndridge Cir
- 29 Aspen Dr
- 10 Oakland Ridge Rd Unit 11
- 16 Berkeley St
- 43 & 53 5th St
- 51 Richardson Ave
- 21 Hinds Ln
- 339 Passaconaway Dr
- 5 Lisa Terrace
- 21 Brook Dr
- 62 Magnolia Dr
- 15 Goldfinch Dr
- 36 Fanning Ave
- 10 Vandette Ave
- 4 Sagewood Dr
- 1310 Mammoth Rd
- 14 Dale Ave
Your Personal Tour Guide
Ask me questions while you tour the home.