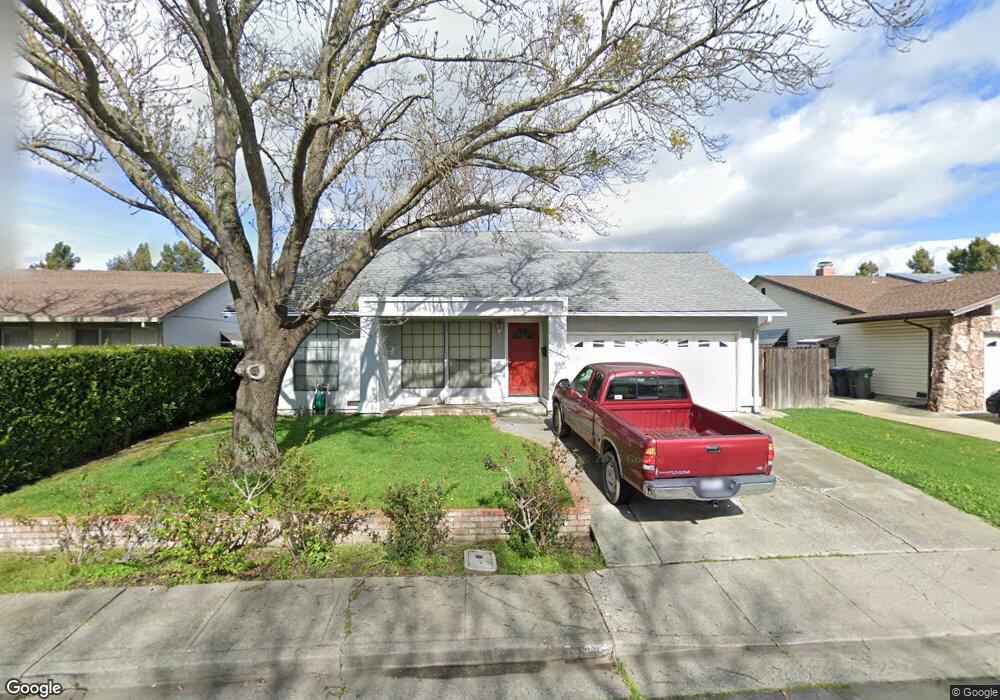
590 Berkeley Way Fairfield, CA 94533
Estimated Value: $497,549 - $535,000
4
Beds
2
Baths
1,549
Sq Ft
$336/Sq Ft
Est. Value
About This Home
This home is located at 590 Berkeley Way, Fairfield, CA 94533 and is currently estimated at $521,137, approximately $336 per square foot. 590 Berkeley Way is a home located in Solano County with nearby schools including Dover Elementary School, Grange Middle School, and Fairfield High School.
Ownership History
Date
Name
Owned For
Owner Type
Purchase Details
Closed on
May 6, 2006
Sold by
Hunt Gordon E and Hunt Shelli R
Bought by
Hunt Gordon E and Hunt Shelli R
Current Estimated Value
Purchase Details
Closed on
Feb 20, 1998
Sold by
Hunt Gordon & Baldwin Shelli and Hunt Shelli
Bought by
Hunt Gordon and Hunt Shelli
Home Financials for this Owner
Home Financials are based on the most recent Mortgage that was taken out on this home.
Original Mortgage
$143,785
Outstanding Balance
$25,228
Interest Rate
6.9%
Mortgage Type
VA
Estimated Equity
$495,909
Purchase Details
Closed on
Jul 31, 1995
Sold by
Hunt Gordon
Bought by
Hunt Gordon and Baldwin Shelli
Purchase Details
Closed on
Apr 1, 1995
Sold by
Cannon Paul M and Cannon Heather E
Bought by
Hunt Gordon E
Home Financials for this Owner
Home Financials are based on the most recent Mortgage that was taken out on this home.
Original Mortgage
$139,565
Interest Rate
7.92%
Mortgage Type
Assumption
Create a Home Valuation Report for This Property
The Home Valuation Report is an in-depth analysis detailing your home's value as well as a comparison with similar homes in the area
Home Values in the Area
Average Home Value in this Area
Purchase History
| Date | Buyer | Sale Price | Title Company |
|---|---|---|---|
| Hunt Gordon E | -- | None Available | |
| Hunt Gordon E | -- | None Available | |
| Hunt Gordon | -- | First American Title Guarant | |
| Hunt Gordon | -- | -- | |
| Hunt Gordon E | $136,000 | -- |
Source: Public Records
Mortgage History
| Date | Status | Borrower | Loan Amount |
|---|---|---|---|
| Open | Hunt Gordon | $143,785 | |
| Previous Owner | Hunt Gordon E | $139,565 |
Source: Public Records
Tax History
| Year | Tax Paid | Tax Assessment Tax Assessment Total Assessment is a certain percentage of the fair market value that is determined by local assessors to be the total taxable value of land and additions on the property. | Land | Improvement |
|---|---|---|---|---|
| 2025 | $2,480 | $227,575 | $75,575 | $152,000 |
| 2024 | $2,480 | $223,114 | $74,094 | $149,020 |
| 2023 | $2,402 | $218,741 | $72,642 | $146,099 |
| 2022 | $2,372 | $214,453 | $71,218 | $143,235 |
| 2021 | $2,347 | $210,249 | $69,822 | $140,427 |
| 2020 | $2,292 | $208,095 | $69,107 | $138,988 |
| 2019 | $2,234 | $204,015 | $67,752 | $136,263 |
| 2018 | $2,304 | $200,016 | $66,424 | $133,592 |
| 2017 | $2,197 | $196,095 | $65,122 | $130,973 |
| 2016 | $2,174 | $192,251 | $63,846 | $128,405 |
| 2015 | $2,028 | $189,364 | $62,887 | $126,477 |
| 2014 | $2,009 | $185,656 | $61,656 | $124,000 |
Source: Public Records
Map
Nearby Homes
- 570 Berkeley Way
- 2513 Sunrise Dr
- 500 Asbury Ln
- 2450 Oceanic Dr
- 432 Chelsea Way
- 772 Largo Ct
- 2825 Sundown Cir
- 2532 Beaufort Ct
- 2827 Sunburst Dr
- 445 Lakehurst Ct
- 2936 Sunbird Dr
- 400 Santa Maria Dr
- 50 El Basset Ct Unit 1
- 2429 Baltic Dr
- 2924 Redwood Dr
- 175 Del Sur Ct
- 68 El Toro Ct
- 2275 Dover Ave
- 2915 N Texas St Unit 129
- 2915 N Texas St Unit 157
- 584 Berkeley Way
- 598 Berkeley Way
- 591 Cement Hill Rd
- 585 Cement Hill Rd
- 578 Berkeley Way
- 599 Cement Hill Rd
- 573 Cement Hill Rd
- 2594 Pembrook Way
- 601 Berkeley Way
- 567 Cement Hill Rd
- 614 Berkeley Way
- 2586 Pembrook Way
- 603 Cement Hill Rd
- 569 Berkeley Way
- 625 Berkeley Way
- 555 Cement Hill Rd
- 564 Berkeley Way
- 626 Berkeley Way
- 2567 Sunrise Dr
Your Personal Tour Guide
Ask me questions while you tour the home.