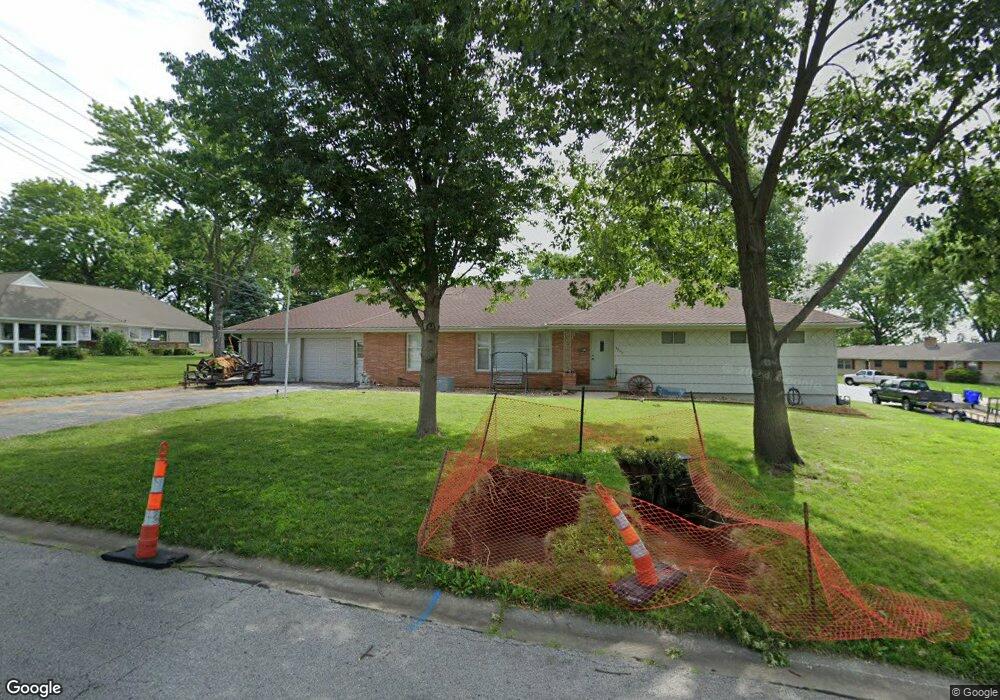
5903 Garnett St Shawnee, KS 66203
Estimated Value: $364,000 - $411,000
2
Beds
3
Baths
1,974
Sq Ft
$195/Sq Ft
Est. Value
About This Home
This home is located at 5903 Garnett St, Shawnee, KS 66203 and is currently estimated at $384,322, approximately $194 per square foot. 5903 Garnett St is a home located in Johnson County with nearby schools including Bluejacket / Flint Elementary, Hocker Grove Middle School, and Shawnee Mission North High School.
Create a Home Valuation Report for This Property
The Home Valuation Report is an in-depth analysis detailing your home's value as well as a comparison with similar homes in the area
Home Values in the Area
Average Home Value in this Area
Tax History Compared to Growth
Tax History
| Year | Tax Paid | Tax Assessment Tax Assessment Total Assessment is a certain percentage of the fair market value that is determined by local assessors to be the total taxable value of land and additions on the property. | Land | Improvement |
|---|---|---|---|---|
| 2024 | $4,553 | $42,953 | $7,642 | $35,311 |
| 2023 | $4,392 | $40,952 | $7,642 | $33,310 |
| 2022 | $4,117 | $38,249 | $6,949 | $31,300 |
| 2021 | $3,794 | $33,097 | $6,040 | $27,057 |
| 2020 | $3,524 | $30,325 | $5,483 | $24,842 |
| 2019 | $3,333 | $28,658 | $4,574 | $24,084 |
| 2018 | $3,169 | $27,140 | $4,160 | $22,980 |
| 2017 | $3,048 | $25,691 | $4,160 | $21,531 |
| 2016 | $2,804 | $23,322 | $4,160 | $19,162 |
| 2015 | $2,615 | $22,598 | $4,160 | $18,438 |
| 2013 | -- | $21,632 | $4,160 | $17,472 |
Source: Public Records
Map
Nearby Homes
- 5845 Caenen St
- 5620 Monrovia St
- 12508 W 56th St
- 5504 Monrovia St
- 11002 W 55th Terrace
- 5407 Halsey St
- 12116 W 63rd Terrace
- 11815 W 53rd St
- 12809 W 57th Terrace
- 5308 Mcanany Dr
- 12225 W 64th Terrace
- 5807 Noland Rd
- Ashwood Plan at Bristol Highlands - North
- The Fleetwood Plan at Bristol Highlands - The Villas
- Cypress II Plan at Bristol Highlands - North
- The Fleetwood Plan at Bristol Highlands - The Manors
- The Brentwood Plan at Bristol Highlands - The Villas
- Yorkshire V Plan at Bristol Highlands - North
- The Kirkwood Plan at Bristol Highlands - The Villas
- 8013 Payne St
- 11711 Johnson Dr
- 11702 W 59th Terrace
- 11711 W 59th Terrace
- 5906 Garnett St
- 11701 Johnson Dr
- 11701 W 59th Terrace
- 11813 Johnson Dr
- 5908 Garnett St
- 5911 Garnett St
- 5910 Garnett St
- 5903 Quivira Rd
- 11619 Johnson Dr
- 11823 Johnson Dr
- 5905 Quivira Rd
- 11770 Johnson Dr
- 11708 Johnson Dr
- 5919 Garnett St
- 11615 Johnson Dr
- 11700 Johnson Dr
- 11808 Johnson Dr