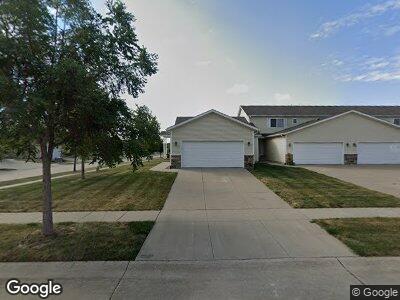
5905 Alec Ave Unit 5905 Davenport, IA 52804
Outer Davenport/Bettendorf NeighborhoodEstimated Value: $185,000 - $228,289
3
Beds
2
Baths
1,110
Sq Ft
$191/Sq Ft
Est. Value
About This Home
This home is located at 5905 Alec Ave Unit 5905, Davenport, IA 52804 and is currently estimated at $212,322, approximately $191 per square foot. 5905 Alec Ave Unit 5905 is a home located in Scott County with nearby schools including Jackson Elementary School, Frank L. Smart Intermediate School, and West High School.
Ownership History
Date
Name
Owned For
Owner Type
Purchase Details
Closed on
Jun 25, 2015
Sold by
Elliott Deborah A and Elliott Brandon M
Bought by
Wamsley Mark
Current Estimated Value
Home Financials for this Owner
Home Financials are based on the most recent Mortgage that was taken out on this home.
Original Mortgage
$119,000
Interest Rate
3.83%
Mortgage Type
New Conventional
Purchase Details
Closed on
May 7, 2015
Sold by
Jones Donald P and Jones Janet M
Bought by
Jones Janet M
Home Financials for this Owner
Home Financials are based on the most recent Mortgage that was taken out on this home.
Original Mortgage
$119,000
Interest Rate
3.83%
Mortgage Type
New Conventional
Purchase Details
Closed on
Apr 9, 2009
Sold by
Robson Homes Inc
Bought by
Elliott Deborah A and Elliott Brandon M
Home Financials for this Owner
Home Financials are based on the most recent Mortgage that was taken out on this home.
Original Mortgage
$140,545
Interest Rate
4.92%
Mortgage Type
Purchase Money Mortgage
Create a Home Valuation Report for This Property
The Home Valuation Report is an in-depth analysis detailing your home's value as well as a comparison with similar homes in the area
Home Values in the Area
Average Home Value in this Area
Purchase History
| Date | Buyer | Sale Price | Title Company |
|---|---|---|---|
| Wamsley Mark | $149,000 | Attorney | |
| Elliott Deborah A | $150,000 | None Available |
Source: Public Records
Mortgage History
| Date | Status | Borrower | Loan Amount |
|---|---|---|---|
| Open | Wamsley Mark | $123,000 | |
| Closed | Wamsley Mark | $123,000 | |
| Closed | Wamsley Mark | $119,000 | |
| Previous Owner | Elliott Deborah A | $140,545 |
Source: Public Records
Tax History Compared to Growth
Tax History
| Year | Tax Paid | Tax Assessment Tax Assessment Total Assessment is a certain percentage of the fair market value that is determined by local assessors to be the total taxable value of land and additions on the property. | Land | Improvement |
|---|---|---|---|---|
| 2024 | $3,436 | $214,480 | $10,960 | $203,520 |
| 2023 | $3,845 | $214,480 | $10,960 | $203,520 |
| 2022 | $4,205 | $182,110 | $9,740 | $172,370 |
| 2021 | $3,716 | $182,110 | $9,740 | $172,370 |
| 2020 | $3,654 | $169,570 | $9,740 | $159,830 |
| 2019 | $3,536 | $158,610 | $9,740 | $148,870 |
| 2018 | $3,120 | $158,610 | $9,740 | $148,870 |
| 2017 | $3,234 | $150,770 | $9,740 | $141,030 |
| 2016 | $3,302 | $150,770 | $0 | $0 |
| 2015 | $3,302 | $141,580 | $0 | $0 |
| 2014 | $2,950 | $141,580 | $0 | $0 |
| 2013 | $2,896 | $0 | $0 | $0 |
| 2012 | -- | $140,150 | $11,300 | $128,850 |
Source: Public Records
Map
Nearby Homes
- 1611 Carson Ct
- 1708 Westport Dr
- 5823 Shawnee Dr
- 1631 Westport Dr
- 1607 Westport Dr
- 1543 Westport Dr
- 1539 Westport Dr
- 1525 Westport Dr
- 1536 Rhinelander Dr
- 1520 Rhinelander Dr
- 1515 Rhinelander Dr
- 6225 W Locust St
- 1417 Rhinelander Dr
- Lot 14 Baraboo Ct
- Lot 5 Baraboo Ct
- 1609 Spring Green Dr
- 1506 Kenosha Ct
- Lot 5 Hidden Valley Dr
- 4628 W 11th St
- 818 N Utah Ave
- 5905 Alec Ave Unit 5905
- 5907 Alec Ave
- 5911 Alec Ave
- 5913 Alec Ave
- 5908 Alec Ave
- 5906 Alec Ave Unit 5906
- 1737 Jenna Dr
- 5919 Alec Ave
- 1735 Jenna Dr
- 1731 Jenna Dr
- 5912 Alec Ave
- 1729 Jenna Dr
- 5921 Alec Ave
- 1723 Jenna Dr
- 5906 Austin
- 5912 Austin Ave
- 5910 Austin Ave
- 5914 Alec Ave
- 5920 Alec Ave
- 1721 Jenna Dr