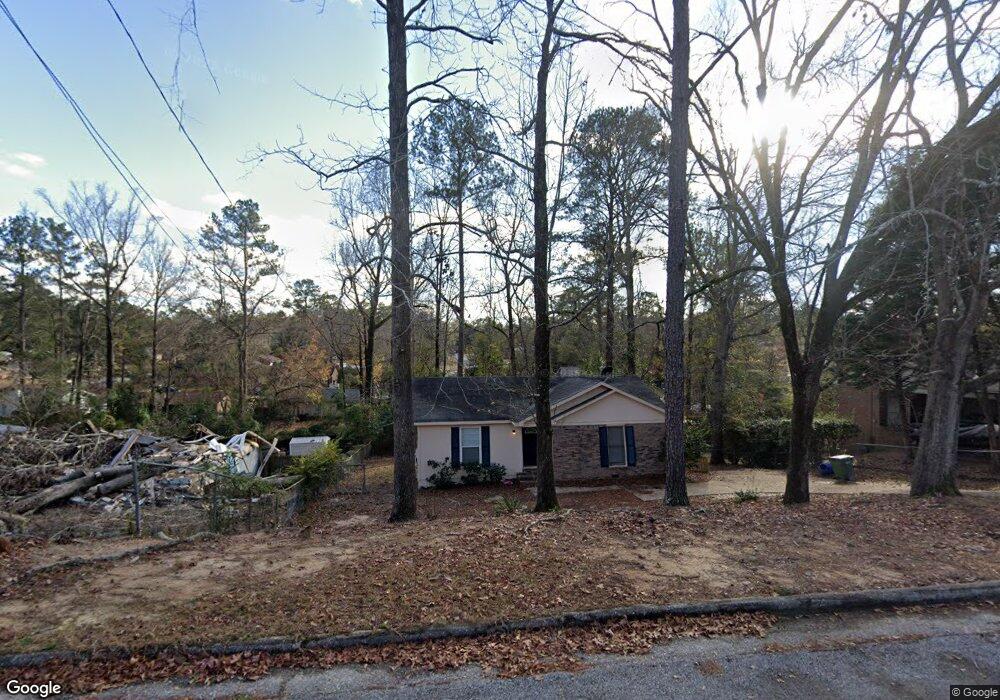
5906 Gleneden Dr Columbus, GA 31907
Eastern Columbus NeighborhoodEstimated Value: $86,000 - $135,000
3
Beds
2
Baths
1,071
Sq Ft
$101/Sq Ft
Est. Value
About This Home
This home is located at 5906 Gleneden Dr, Columbus, GA 31907 and is currently estimated at $108,594, approximately $101 per square foot. 5906 Gleneden Dr is a home located in Muscogee County with nearby schools including Forrest Road Elementary School, Fort Middle School, and Kendrick High School.
Ownership History
Date
Name
Owned For
Owner Type
Purchase Details
Closed on
Apr 30, 2024
Sold by
Doyle Quina Labree and Morgan Quina Labree
Bought by
Blumen Group Llc
Current Estimated Value
Purchase Details
Closed on
Oct 6, 2020
Sold by
Red Stick Acquisitions Llc
Bought by
Morgan Quina Labree
Purchase Details
Closed on
Apr 25, 2017
Sold by
Home Investment Fund Iii Lp
Bought by
Red Stick Acquisitions Llc
Purchase Details
Closed on
Feb 24, 2016
Sold by
Domus Holdings Llc
Bought by
Rocktop Mountainview Llc
Purchase Details
Closed on
Oct 30, 2015
Sold by
Us Bank National Associati
Bought by
Domus Holdings Llc
Purchase Details
Closed on
Feb 3, 2015
Sold by
Mcbee Gwendolyn H
Bought by
Us Bank National Association T
Create a Home Valuation Report for This Property
The Home Valuation Report is an in-depth analysis detailing your home's value as well as a comparison with similar homes in the area
Home Values in the Area
Average Home Value in this Area
Purchase History
| Date | Buyer | Sale Price | Title Company |
|---|---|---|---|
| Blumen Group Llc | $67,500 | None Listed On Document | |
| Morgan Quina Labree | $55,500 | None Listed On Document | |
| Doyle Quina Labree | $55,500 | -- | |
| Red Stick Acquisitions Llc | -- | -- | |
| Rocktop Mountainview Llc | $34,400 | -- | |
| Domus Holdings Llc | $21,150 | -- | |
| Us Bank National Association T | $53,791 | -- |
Source: Public Records
Tax History Compared to Growth
Tax History
| Year | Tax Paid | Tax Assessment Tax Assessment Total Assessment is a certain percentage of the fair market value that is determined by local assessors to be the total taxable value of land and additions on the property. | Land | Improvement |
|---|---|---|---|---|
| 2025 | $1,921 | $49,064 | $7,080 | $41,984 |
| 2024 | $1,426 | $36,420 | $7,080 | $29,340 |
| 2023 | $1,435 | $36,420 | $7,080 | $29,340 |
| 2022 | $1,281 | $31,384 | $7,080 | $24,304 |
| 2021 | $910 | $22,200 | $6,760 | $15,440 |
| 2020 | $1,109 | $27,152 | $7,080 | $20,072 |
| 2019 | $1,112 | $27,152 | $7,080 | $20,072 |
| 2018 | $1,112 | $27,152 | $7,080 | $20,072 |
| 2017 | $566 | $13,760 | $3,560 | $10,200 |
| 2016 | $347 | $8,400 | $2,925 | $5,475 |
| 2015 | $394 | $23,845 | $2,925 | $20,920 |
| 2014 | $251 | $23,845 | $2,925 | $20,920 |
| 2013 | -- | $23,845 | $2,925 | $20,920 |
Source: Public Records
Map
Nearby Homes
- 5920 Gleneden Dr
- 2525 Corineth Dr
- 5929 Gleneden Dr
- 5833 Gleneden Dr
- 6059 Nassau Cir
- 5906 Forrest Rd
- 2807 Doyle Ave
- 2672 Honeysuckle Dr
- 6028 Caribou Dr
- 6000 Caribou Dr
- 2940 Urban Ave
- 3027 Lansing Ave
- 6916 Bradshaw Dr
- 2501 White Chapel Dr
- 2505 White Chapel Dr
- 3301 Musket Dr
- 2708 Courtland Ave
- 6213 Fitzgerald Dr
- 6032 Cordova Rd
- 1754 Mazor Dr
- 5912 Gleneden Dr
- 5900 Gleneden Dr
- 5840 Gleneden Dr
- 5901 Glenmere Dr
- 5907 Gleneden Dr
- 5907 Glenmere Dr
- 5901 Gleneden Dr
- 5847 Glenmere Dr
- 5913 Gleneden Dr
- 5913 Glenmere Dr
- 5926 Gleneden Dr
- 5841 Glenmere Dr
- 5841 Gleneden Dr
- 5921 Gleneden Dr
- 5832 Gleneden Dr
- 5835 Glenmere Dr
- 5919 Glenmere Dr
- 2541 Druid Ct
- 5932 Gleneden Dr
- 2537 Druid Ct