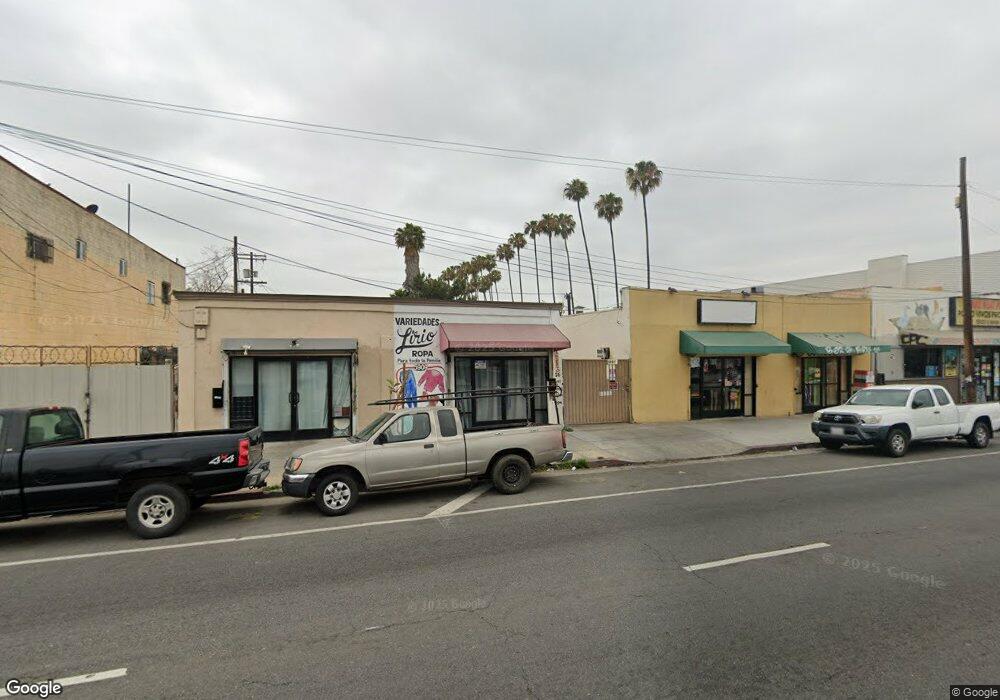
5909 S Main St Los Angeles, CA 90003
Florence NeighborhoodEstimated Value: $537,000
2
Beds
2
Baths
688
Sq Ft
$781/Sq Ft
Est. Value
About This Home
This home is located at 5909 S Main St, Los Angeles, CA 90003 and is currently priced at $537,000, approximately $780 per square foot. 5909 S Main St is a home located in Los Angeles County with nearby schools including Los Angeles Academy Middle School, Academy For Multiligual Arts And Science At Mervyn M. Dymally High, and Aspire Slauson Academy.
Ownership History
Date
Name
Owned For
Owner Type
Purchase Details
Closed on
Mar 23, 2016
Sold by
Khoubian Arman
Bought by
5909 Main Llc
Current Estimated Value
Home Financials for this Owner
Home Financials are based on the most recent Mortgage that was taken out on this home.
Original Mortgage
$157,500
Outstanding Balance
$124,661
Interest Rate
3.65%
Mortgage Type
Commercial
Purchase Details
Closed on
Jul 23, 2013
Sold by
Federal Home Loans Corporation
Bought by
Khoubian Arman
Purchase Details
Closed on
Dec 13, 2012
Sold by
Lopez Valentine
Bought by
Federal Home Loans Corporation
Purchase Details
Closed on
Apr 29, 1998
Sold by
Lopez Amalia
Bought by
Lopez Valentin
Home Financials for this Owner
Home Financials are based on the most recent Mortgage that was taken out on this home.
Original Mortgage
$85,000
Interest Rate
7.1%
Mortgage Type
Commercial
Purchase Details
Closed on
Jan 31, 1998
Sold by
Lopez Gregorio
Bought by
Lopez Valentin
Create a Home Valuation Report for This Property
The Home Valuation Report is an in-depth analysis detailing your home's value as well as a comparison with similar homes in the area
Home Values in the Area
Average Home Value in this Area
Purchase History
| Date | Buyer | Sale Price | Title Company |
|---|---|---|---|
| 5909 Main Llc | -- | Ticor Title | |
| Khoubian Arman | -- | Stewart Title Of Ca Inc | |
| Federal Home Loans Corporation | $155,746 | Stewart Title | |
| Lopez Valentin | -- | United Title Company | |
| Lopez Valentin | -- | -- |
Source: Public Records
Mortgage History
| Date | Status | Borrower | Loan Amount |
|---|---|---|---|
| Open | 5909 Main Llc | $157,500 | |
| Previous Owner | Lopez Valentin | $85,000 |
Source: Public Records
Tax History Compared to Growth
Tax History
| Year | Tax Paid | Tax Assessment Tax Assessment Total Assessment is a certain percentage of the fair market value that is determined by local assessors to be the total taxable value of land and additions on the property. | Land | Improvement |
|---|---|---|---|---|
| 2025 | $4,923 | $378,807 | $236,756 | $142,051 |
| 2024 | $4,923 | $371,380 | $232,114 | $139,266 |
| 2023 | $4,835 | $364,099 | $227,563 | $136,536 |
| 2022 | $4,622 | $356,960 | $223,101 | $133,859 |
| 2021 | $4,561 | $349,962 | $218,727 | $131,235 |
| 2020 | $4,601 | $346,375 | $216,485 | $129,890 |
| 2019 | $4,432 | $339,585 | $212,241 | $127,344 |
| 2018 | $4,310 | $332,928 | $208,080 | $124,848 |
| 2016 | $2,427 | $178,628 | $129,441 | $49,187 |
| 2015 | $2,395 | $175,946 | $127,497 | $48,449 |
| 2014 | $2,579 | $172,500 | $125,000 | $47,500 |
Source: Public Records
Map
Nearby Homes
- 138 W 60th St
- 142 W 58th St
- 6118 S Main St
- 5881 S Broadway
- 112 W 62nd St
- 240 E 60th St
- 214 W 57th St
- 323 W 60th St
- 123 E Gage Ave
- 5840 S Olive St
- 5734 S Broadway
- 5907 S Olive St
- 138 W Gage Ave
- 146 W Gage Ave
- 123 W 56th St
- 6205 S San Pedro St
- 214 E 56th St
- 205 E 64th St
- 333 E 61st St
- 232 E Gage Ave Unit A
- 5907 S Main St
- 114 W 59th St
- 5903 S Main St
- 120 W 59th St
- 122 W 59th St
- 117 W 59th Place
- 115 W 59th Place
- 119 W 59th Place
- 126 W 59th St Unit 3
- 126 W 59th St
- 123 W 59th Place
- 127 W 59th Place
- 113 W 59th St
- 132 W 59th St
- 121 W 59th St
- 131 W 59th Place
- 5955 Main St Unit 10
- 5955 Main St Unit 5
- 5955 Main St Unit 19
- 136 W 59th St