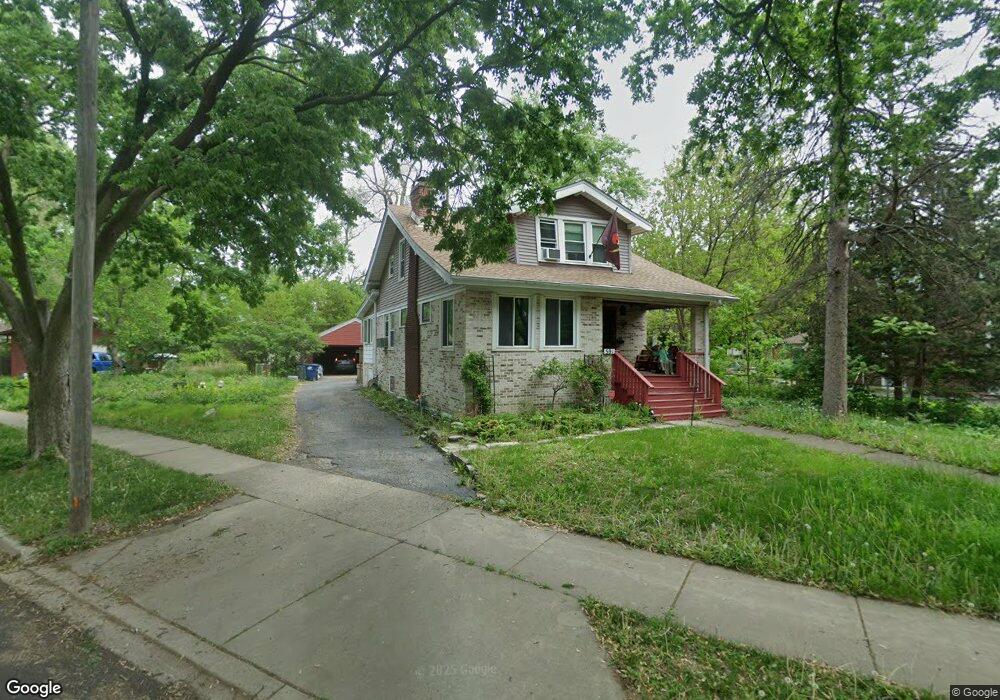
591 Arlington Ave Des Plaines, IL 60016
Estimated Value: $389,000 - $505,000
3
Beds
2
Baths
1,658
Sq Ft
$269/Sq Ft
Est. Value
About This Home
This home is located at 591 Arlington Ave, Des Plaines, IL 60016 and is currently estimated at $445,866, approximately $268 per square foot. 591 Arlington Ave is a home located in Cook County with nearby schools including Central Elementary School, Chippewa Middle School, and Maine West High School.
Ownership History
Date
Name
Owned For
Owner Type
Purchase Details
Closed on
Apr 12, 2021
Sold by
Berman Dale N and Berman Katharine L
Bought by
Berman Tamara Brie
Current Estimated Value
Home Financials for this Owner
Home Financials are based on the most recent Mortgage that was taken out on this home.
Original Mortgage
$160,000
Interest Rate
3.5%
Mortgage Type
New Conventional
Purchase Details
Closed on
Oct 27, 2016
Sold by
Berman Dale Nathan and Berman Katharine M
Bought by
Berman Dale N and Berman Katharine L
Purchase Details
Closed on
Apr 16, 1997
Sold by
Boyer Florence B
Bought by
Berman Dale and Berman Katherine
Purchase Details
Closed on
Dec 1, 1995
Sold by
Brogmus Russell J and Brogmus Carol A
Bought by
Berman Dale Nathan and Berman Katharine M
Home Financials for this Owner
Home Financials are based on the most recent Mortgage that was taken out on this home.
Original Mortgage
$172,800
Interest Rate
6.62%
Create a Home Valuation Report for This Property
The Home Valuation Report is an in-depth analysis detailing your home's value as well as a comparison with similar homes in the area
Home Values in the Area
Average Home Value in this Area
Purchase History
We collect this data history from publicly available records. To have your information removed, we recommend requesting removal directly through your county’s website.
| Date | Buyer | Sale Price | Title Company |
|---|---|---|---|
| Berman Tamara Brie | $200,000 | Citywide Title Corporation | |
| Berman Dale N | -- | Attorney | |
| Berman Dale | $2,500 | -- | |
| Berman Dale Nathan | $216,000 | -- |
Source: Public Records
Mortgage History
We collect this data history from publicly available records. To have your information removed, we recommend requesting removal directly through your county’s website.
| Date | Status | Borrower | Loan Amount |
|---|---|---|---|
| Previous Owner | Berman Tamara Brie | $160,000 | |
| Previous Owner | Berman Dale Nathan | $172,800 |
Source: Public Records
Tax History
| Year | Tax Paid | Tax Assessment Tax Assessment Total Assessment is a certain percentage of the fair market value that is determined by local assessors to be the total taxable value of land and additions on the property. | Land | Improvement |
|---|---|---|---|---|
| 2025 | $8,173 | $41,000 | $10,800 | $30,200 |
| 2024 | $8,173 | $31,000 | $9,600 | $21,400 |
| 2023 | $7,977 | $31,000 | $9,600 | $21,400 |
| 2022 | $7,977 | $31,000 | $9,600 | $21,400 |
| 2021 | $7,448 | $30,226 | $7,800 | $22,426 |
| 2020 | $7,447 | $30,226 | $7,800 | $22,426 |
| 2019 | $7,377 | $33,585 | $7,800 | $25,785 |
| 2018 | $6,939 | $26,637 | $6,900 | $19,737 |
| 2017 | $6,834 | $26,637 | $6,900 | $19,737 |
| 2016 | $6,708 | $26,637 | $6,900 | $19,737 |
| 2015 | $6,737 | $24,908 | $6,000 | $18,908 |
| 2014 | $6,611 | $24,908 | $6,000 | $18,908 |
| 2013 | $6,429 | $24,908 | $6,000 | $18,908 |
Source: Public Records
Map
Nearby Homes
- 1288 Perry St Unit 2
- 1308 Perry St Unit B
- 390 S Western Ave Unit 605
- 1327 Brown St Unit 407
- 1363 Perry St Unit 2B
- 700 Graceland Ave Unit 207
- 1378 Perry St Unit 206
- 1389 Perry St Unit 203
- 1349 E Washington St Unit 310A
- 1100 Evergreen Ave
- 946 Walter Ave
- 963 E Prairie Ave
- 910 Hollywood Ave
- 365 Graceland Ave Unit 606A
- 365 Graceland Ave Unit 205A
- 775 Lee St
- 879 North Ave
- 890 North Ave
- 1333 Willow Ave
- 1480 Jefferson St Unit 203A
- 560 Webford Ave
- 562 Webford Ave
- 556 Webford Ave
- 564 Webford Ave
- 548 Webford Ave
- 566 Webford Ave
- 553 Webford Ave
- 609 Parsons Ave
- 570 Webford Ave
- 547 Webford Ave
- 551 Arlington Ave
- 542 Webford Ave
- 535 Webford Ave
- 611 Parsons Ave
- 572 Webford Ave
- 615 Parsons Ave
- 555 Webford Ave
- 554 Arlington Ave
- 576 Arlington Ave
- 621 Parsons Ave
Your Personal Tour Guide
Ask me questions while you tour the home.