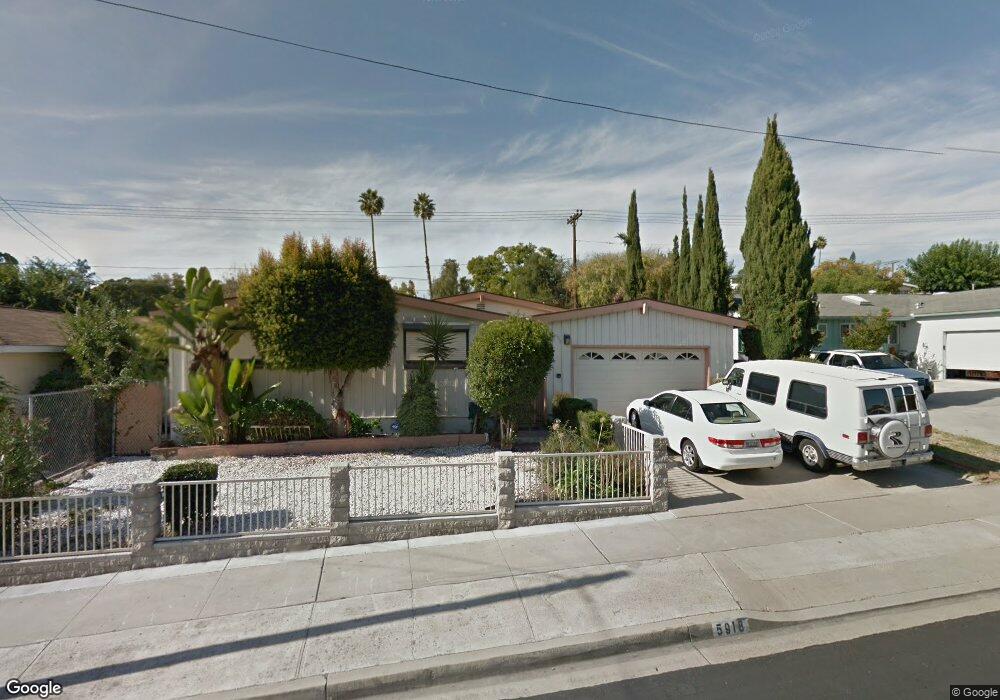
5918 Lake Murray Blvd La Mesa, CA 91942
Estimated Value: $918,000 - $1,080,000
5
Beds
3
Baths
1,823
Sq Ft
$552/Sq Ft
Est. Value
About This Home
This home is located at 5918 Lake Murray Blvd, La Mesa, CA 91942 and is currently estimated at $1,006,471, approximately $552 per square foot. 5918 Lake Murray Blvd is a home located in San Diego County with nearby schools including Murray Manor Elementary School, Parkway Academy, and Grossmont High School.
Ownership History
Date
Name
Owned For
Owner Type
Purchase Details
Closed on
Sep 14, 2017
Sold by
Neighborhood Rehab Group Inc
Bought by
Helix Partners Real Estate Group Llc
Current Estimated Value
Purchase Details
Closed on
Jun 14, 2017
Sold by
Williams Doris
Bought by
Neighborhood Rehab Group Inc
Purchase Details
Closed on
Jun 19, 2015
Sold by
Findley Emma L
Bought by
Findley Emma L
Home Financials for this Owner
Home Financials are based on the most recent Mortgage that was taken out on this home.
Original Mortgage
$709,500
Interest Rate
2.93%
Mortgage Type
Reverse Mortgage Home Equity Conversion Mortgage
Purchase Details
Closed on
May 18, 2006
Sold by
Findley Winfred and Findley Emma L
Bought by
Findley Winfred and Findley Emma L
Create a Home Valuation Report for This Property
The Home Valuation Report is an in-depth analysis detailing your home's value as well as a comparison with similar homes in the area
Purchase History
| Date | Buyer | Sale Price | Title Company |
|---|---|---|---|
| Helix Partners Real Estate Group Llc | $645,000 | Lawyers Title | |
| Neighborhood Rehab Group Inc | $480,000 | Lawyers Title | |
| Findley Emma L | -- | Tsi Title | |
| Findley Winfred | -- | None Available |
Source: Public Records
Mortgage History
| Date | Status | Borrower | Loan Amount |
|---|---|---|---|
| Previous Owner | Findley Emma L | $709,500 |
Source: Public Records
Tax History
| Year | Tax Paid | Tax Assessment Tax Assessment Total Assessment is a certain percentage of the fair market value that is determined by local assessors to be the total taxable value of land and additions on the property. | Land | Improvement |
|---|---|---|---|---|
| 2025 | $9,549 | $733,896 | $472,197 | $261,699 |
| 2024 | $9,549 | $719,507 | $462,939 | $256,568 |
| 2023 | $9,234 | $705,400 | $453,862 | $251,538 |
| 2022 | $9,115 | $691,569 | $444,963 | $246,606 |
| 2021 | $8,827 | $678,010 | $436,239 | $241,771 |
| 2020 | $8,469 | $671,058 | $431,766 | $239,292 |
| 2019 | $8,282 | $657,900 | $423,300 | $234,600 |
| 2018 | $8,072 | $645,000 | $415,000 | $230,000 |
| 2017 | $1,498 | $98,292 | $29,440 | $68,852 |
| 2016 | $1,437 | $96,365 | $28,863 | $67,502 |
| 2015 | $1,407 | $94,919 | $28,430 | $66,489 |
| 2014 | -- | $93,061 | $27,874 | $65,187 |
Source: Public Records
Map
Nearby Homes
- 5875 Lake Murray Blvd
- 5800 Lake Murray Blvd Unit 88
- 6060 Cowles Mountain Blvd
- 8330 Dallas St
- 6528 Jackson Dr
- 5715 Baltimore Dr Unit 39
- 5715 Baltimore Dr Unit 23
- 5715 Baltimore Dr Unit 91
- 5649 Lake Murray Blvd Unit B
- 6732 Jackson Dr
- 5490 Aztec Dr
- 5700 Baltimore Dr Unit 206
- 5700 Baltimore Dr Unit 230
- 5700 Baltimore Dr Unit 195
- 5700 Baltimore Dr Unit 66
- 5712 Baltimore Dr Unit 491
- 5710 Baltimore Dr Unit 430
- 5710 Baltimore Dr Unit 433
- 5710 Baltimore Dr Unit 429
- 6252 Lake Albano Ave
- 5912 Lake Murray Blvd
- 5924 Lake Murray Blvd
- 5945 Samuel St
- 5955 Samuel St
- 5935 Samuel St
- 5906 Lake Murray Blvd
- 5930 Lake Murray Blvd
- 5965 Samuel St
- 5925 Samuel St
- 5900 Lake Murray Blvd
- 5936 Lake Murray Blvd
- 5915 Lake Murray Blvd
- 5921 Lake Murray Blvd
- 5911 Lake Murray Blvd
- 5975 Samuel St
- 5915 Samuel St
- 5935 Lake Murray Blvd
- 5942 Lake Murray Blvd
- 5905 Lake Murray Blvd
- 5940 Samuel St
Your Personal Tour Guide
Ask me questions while you tour the home.