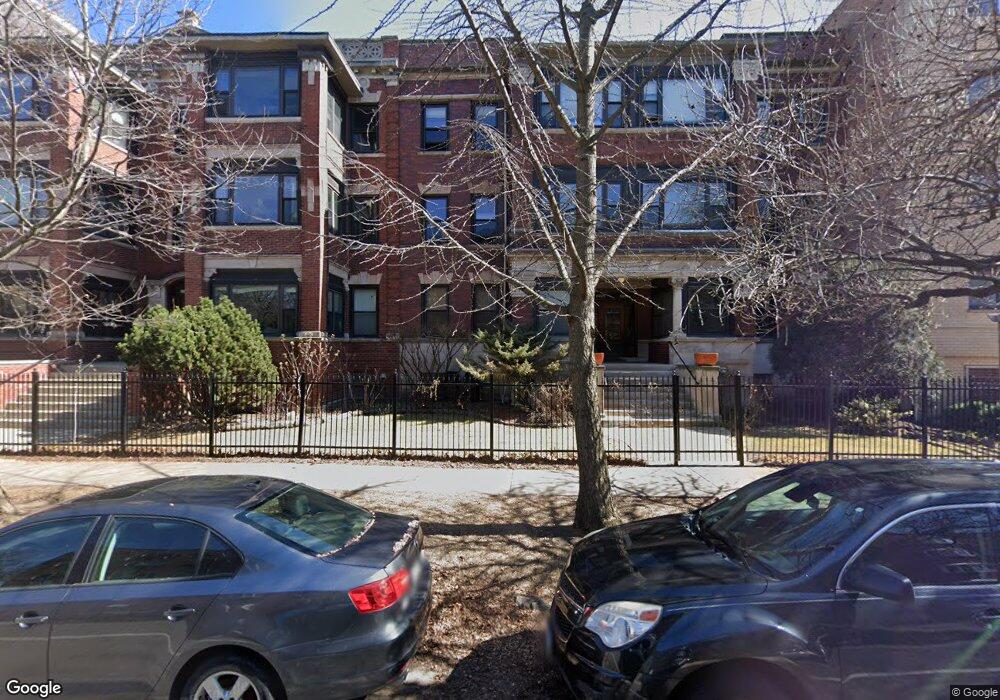
5921 N Kenmore Ave Unit 3 Chicago, IL 60660
Edgewater NeighborhoodEstimated Value: $348,000 - $405,000
2
Beds
1
Bath
1,500
Sq Ft
$250/Sq Ft
Est. Value
About This Home
This home is located at 5921 N Kenmore Ave Unit 3, Chicago, IL 60660 and is currently estimated at $375,620, approximately $250 per square foot. 5921 N Kenmore Ave Unit 3 is a home located in Cook County with nearby schools including Senn High School, Sacred Heart Schools, and Northside Catholic Academy.
Ownership History
Date
Name
Owned For
Owner Type
Purchase Details
Closed on
Nov 17, 2005
Sold by
Lahue Colby
Bought by
Zech Jason and Zech Kelly
Current Estimated Value
Home Financials for this Owner
Home Financials are based on the most recent Mortgage that was taken out on this home.
Original Mortgage
$228,000
Outstanding Balance
$121,699
Interest Rate
5.62%
Mortgage Type
Unknown
Estimated Equity
$253,921
Purchase Details
Closed on
Sep 23, 1999
Sold by
Mitchell Thomas
Bought by
Lahue Colby J
Home Financials for this Owner
Home Financials are based on the most recent Mortgage that was taken out on this home.
Original Mortgage
$144,000
Interest Rate
7.91%
Purchase Details
Closed on
Oct 27, 1994
Sold by
American National Bk & Tr Co Of Chicago
Bought by
Mitchell Thomas W
Home Financials for this Owner
Home Financials are based on the most recent Mortgage that was taken out on this home.
Original Mortgage
$87,300
Interest Rate
8.25%
Create a Home Valuation Report for This Property
The Home Valuation Report is an in-depth analysis detailing your home's value as well as a comparison with similar homes in the area
Home Values in the Area
Average Home Value in this Area
Purchase History
| Date | Buyer | Sale Price | Title Company |
|---|---|---|---|
| Zech Jason | $285,000 | First American Title Ins Co | |
| Lahue Colby J | $160,000 | -- | |
| Mitchell Thomas W | $97,000 | -- |
Source: Public Records
Mortgage History
| Date | Status | Borrower | Loan Amount |
|---|---|---|---|
| Open | Zech Jason | $228,000 | |
| Previous Owner | Lahue Colby J | $144,000 | |
| Previous Owner | Mitchell Thomas W | $87,300 |
Source: Public Records
Tax History Compared to Growth
Tax History
| Year | Tax Paid | Tax Assessment Tax Assessment Total Assessment is a certain percentage of the fair market value that is determined by local assessors to be the total taxable value of land and additions on the property. | Land | Improvement |
|---|---|---|---|---|
| 2024 | $4,364 | $31,416 | $8,487 | $22,929 |
| 2023 | $4,233 | $24,000 | $6,824 | $17,176 |
| 2022 | $4,233 | $24,000 | $6,824 | $17,176 |
| 2021 | $4,156 | $23,999 | $6,823 | $17,176 |
| 2020 | $3,874 | $20,491 | $3,923 | $16,568 |
| 2019 | $3,866 | $22,672 | $3,923 | $18,749 |
| 2018 | $3,800 | $22,672 | $3,923 | $18,749 |
| 2017 | $3,629 | $20,231 | $3,411 | $16,820 |
| 2016 | $3,552 | $20,231 | $3,411 | $16,820 |
| 2015 | $3,227 | $20,231 | $3,411 | $16,820 |
| 2014 | $2,848 | $17,919 | $2,601 | $15,318 |
| 2013 | $2,781 | $17,919 | $2,601 | $15,318 |
Source: Public Records
Map
Nearby Homes
- 5950 N Kenmore Ave Unit 202
- 5950 N Kenmore Ave Unit 306
- 5920 N Kenmore Ave Unit 225
- 6007 N Sheridan Rd Unit 37B
- 6007 N Sheridan Rd Unit 11K
- 6007 N Sheridan Rd Unit 25E
- 6007 N Sheridan Rd Unit 25F
- 6007 N Sheridan Rd Unit 12A
- 6007 N Sheridan Rd Unit 24H
- 6007 N Sheridan Rd Unit 15G
- 6007 N Sheridan Rd Unit 31J
- 6007 N Sheridan Rd Unit 36F
- 6007 N Sheridan Rd Unit 17DF
- 6030 N Sheridan Rd Unit 412
- 6030 N Sheridan Rd Unit 807
- 6030 N Sheridan Rd Unit 1007
- 6030 N Sheridan Rd Unit 2108
- 6030 N Sheridan Rd Unit 1710
- 6030 N Sheridan Rd Unit 404
- 5863 N Kenmore Ave Unit 2
- 5921 N Kenmore Ave Unit 2
- 5921 N Kenmore Ave
- 1023 W Thorndale Ave Unit 1023
- 5919 N Kenmore Ave Unit 59191
- 5921 N Kenmore Ave Unit 59211
- 5921 N Kenmore Ave Unit 59212
- 1023 W Thorndale Ave Unit 1023
- 5921 N Kenmore Ave Unit 59213
- 5919 N Kenmore Ave Unit 59192
- 5919 N Kenmore Ave Unit 59193
- 1023 W Thorndale Ave Unit 1023
- 5919 N Kenmore Ave Unit 2
- 5921 N Kenmore Ave Unit 2
- 5919 N Kenmore Ave Unit 1
- 5921 N Kenmore Ave Unit 1
- 1023 W Thorndale Ave Unit 3
- 5919 N Kenmore Ave Unit 3
- 5925 N Kenmore Ave Unit 1
- 5925 N Kenmore Ave Unit 1
- 5925 N Kenmore Ave Unit 59251