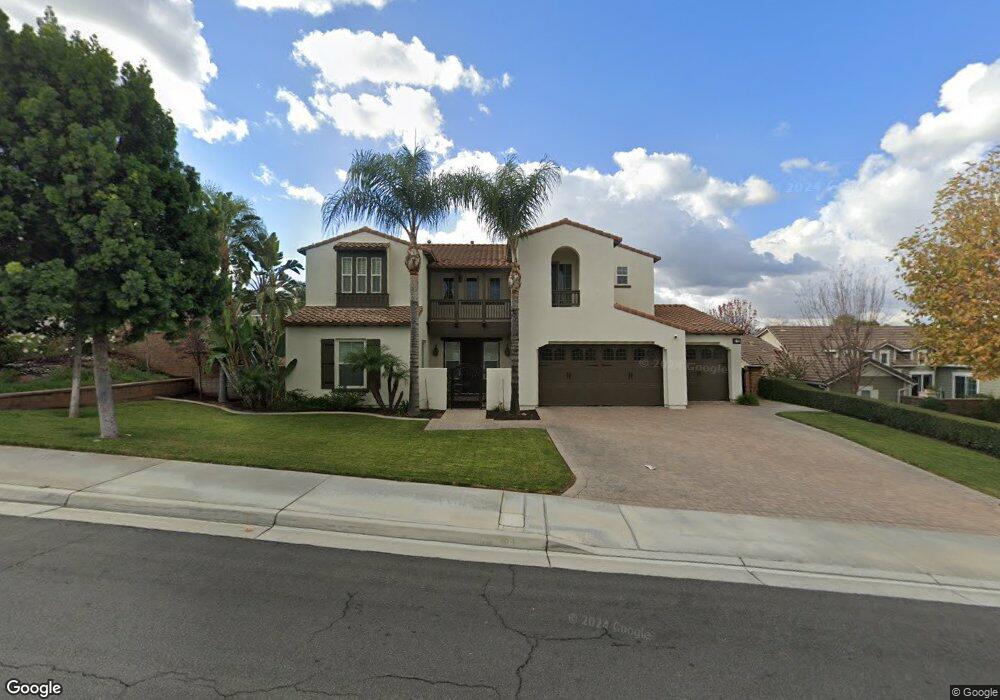
5921 Via Las Nubes Riverside, CA 92506
Estimated Value: $1,031,328 - $1,264,000
4
Beds
4
Baths
3,674
Sq Ft
$319/Sq Ft
Est. Value
About This Home
This home is located at 5921 Via Las Nubes, Riverside, CA 92506 and is currently estimated at $1,171,082, approximately $318 per square foot. 5921 Via Las Nubes is a home located in Riverside County with nearby schools including Emerson Elementary School, University Heights Middle School, and John W. North High School.
Ownership History
Date
Name
Owned For
Owner Type
Purchase Details
Closed on
Aug 12, 2020
Sold by
Ahmed Nanice
Bought by
Ashrif Mohammad and Ahmed Nanice
Current Estimated Value
Home Financials for this Owner
Home Financials are based on the most recent Mortgage that was taken out on this home.
Original Mortgage
$510,000
Outstanding Balance
$451,562
Interest Rate
2.9%
Mortgage Type
New Conventional
Estimated Equity
$719,520
Purchase Details
Closed on
Nov 10, 2009
Sold by
Ashrif Mohammad and Ahmed Nanice
Bought by
Ahmed Nanice
Purchase Details
Closed on
Sep 11, 2007
Sold by
Sheffield Sycamore Canyon Llc
Bought by
Ashrif Mohammad and Ahmed Nanice
Home Financials for this Owner
Home Financials are based on the most recent Mortgage that was taken out on this home.
Original Mortgage
$417,000
Interest Rate
6.4%
Mortgage Type
Purchase Money Mortgage
Create a Home Valuation Report for This Property
The Home Valuation Report is an in-depth analysis detailing your home's value as well as a comparison with similar homes in the area
Home Values in the Area
Average Home Value in this Area
Purchase History
| Date | Buyer | Sale Price | Title Company |
|---|---|---|---|
| Ashrif Mohammad | -- | Lawyers Title Ie | |
| Ahmed Nanice | -- | None Available | |
| Ashrif Mohammad | $725,000 | First American Title Co Nhs |
Source: Public Records
Mortgage History
| Date | Status | Borrower | Loan Amount |
|---|---|---|---|
| Open | Ashrif Mohammad | $510,000 | |
| Closed | Ashrif Mohammad | $417,000 |
Source: Public Records
Tax History Compared to Growth
Tax History
| Year | Tax Paid | Tax Assessment Tax Assessment Total Assessment is a certain percentage of the fair market value that is determined by local assessors to be the total taxable value of land and additions on the property. | Land | Improvement |
|---|---|---|---|---|
| 2025 | $12,682 | $956,937 | $197,016 | $759,921 |
| 2023 | $12,682 | $919,779 | $189,366 | $730,413 |
| 2022 | $12,445 | $901,745 | $185,653 | $716,092 |
| 2021 | $11,911 | $850,000 | $175,000 | $675,000 |
| 2020 | $12,013 | $856,960 | $164,965 | $691,995 |
| 2019 | $11,739 | $832,000 | $160,160 | $671,840 |
| 2018 | $11,380 | $800,000 | $154,000 | $646,000 |
| 2017 | $11,127 | $775,000 | $154,000 | $621,000 |
| 2016 | $10,376 | $740,000 | $155,000 | $585,000 |
| 2015 | $10,512 | $740,000 | $153,000 | $587,000 |
| 2014 | $10,554 | $680,000 | $141,000 | $539,000 |
Source: Public Records
Map
Nearby Homes
- 5600 Via Junipero Serra
- 510 Via Zapata
- 1145 Via Vallarta
- 548 Via la Paloma
- 718 Via la Paloma
- 1341 Nettleton Ct
- 1123 Tolkien Rd
- 600 Central Ave Unit 381
- 600 Central Ave Unit 414
- 600 Central Ave Unit 302
- 600 Central Ave Unit 308
- 876 Via Mesa Verde
- 1000 Central Ave Unit 8
- 1450 Via Vallarta
- 804 Daffodil Dr
- 845 Daffodil Dr
- 1544 Bellefontaine Dr
- 6721 Silver Oak Place
- 564 Via Pueblo
- 1126 Maddie Ln
- 5937 Via Las Nubes
- 5905 Via Las Nubes
- 5922 Via Las Nubes
- 5953 Via Las Nubes
- 5887 Via Las Nubes
- 5944 Via Las Nubes
- 5902 Via Las Nubes
- 5871 Via Las Nubes
- 5962 Via Las Nubes
- 5878 Via Las Nubes
- 5855 Via Las Nubes
- 5982 Via Las Nubes
- 5864 Via Las Nubes
- 5985 Via Las Nubes
- 5839 Via Las Nubes
- 5848 Via Las Nubes
- 5823 Via Las Nubes
- 5828 Via Las Nubes
- 5958 Omega St
- 5807 Via Las Nubes