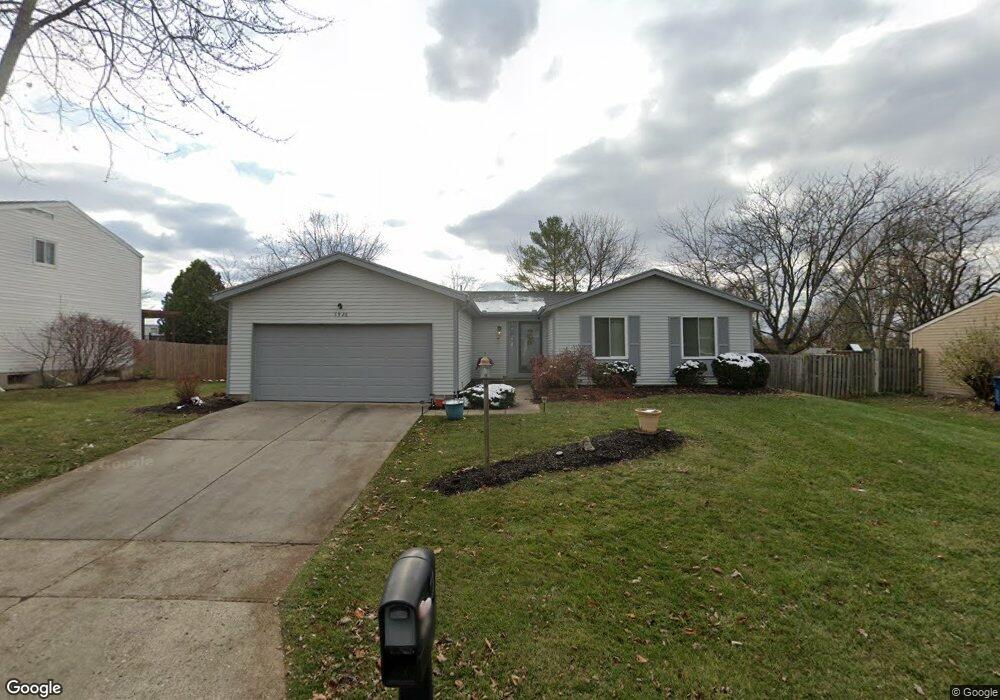
5926 Summersweet Dr Clayton, OH 45315
Estimated Value: $225,000 - $256,000
3
Beds
2
Baths
1,600
Sq Ft
$151/Sq Ft
Est. Value
About This Home
This home is located at 5926 Summersweet Dr, Clayton, OH 45315 and is currently estimated at $241,450, approximately $150 per square foot. 5926 Summersweet Dr is a home located in Montgomery County with nearby schools including Northmoor Elementary School, Northmont High School, and Trotwood Preparatory & Fitness Academy.
Ownership History
Date
Name
Owned For
Owner Type
Purchase Details
Closed on
Jun 20, 2014
Sold by
Shearer Grant and Shearer Joy
Bought by
Stephens Darlene L
Current Estimated Value
Home Financials for this Owner
Home Financials are based on the most recent Mortgage that was taken out on this home.
Original Mortgage
$92,787
Outstanding Balance
$71,103
Interest Rate
4.4%
Mortgage Type
FHA
Estimated Equity
$170,347
Purchase Details
Closed on
Feb 28, 2003
Sold by
Landis Jason E and Landis Kimberly M
Bought by
Shearer Grant and Shearer Joy
Home Financials for this Owner
Home Financials are based on the most recent Mortgage that was taken out on this home.
Original Mortgage
$107,920
Interest Rate
6%
Purchase Details
Closed on
Oct 15, 1998
Sold by
Deis James H and Deis Robin M
Bought by
Landis Jason E
Home Financials for this Owner
Home Financials are based on the most recent Mortgage that was taken out on this home.
Original Mortgage
$94,050
Interest Rate
6.9%
Create a Home Valuation Report for This Property
The Home Valuation Report is an in-depth analysis detailing your home's value as well as a comparison with similar homes in the area
Home Values in the Area
Average Home Value in this Area
Purchase History
| Date | Buyer | Sale Price | Title Company |
|---|---|---|---|
| Stephens Darlene L | $94,500 | None Available | |
| Shearer Grant | $113,600 | Hallmark Title | |
| Landis Jason E | $99,000 | Equity Land Title Agency Inc | |
| Landis Jason E | $99,000 | -- |
Source: Public Records
Mortgage History
| Date | Status | Borrower | Loan Amount |
|---|---|---|---|
| Open | Stephens Darlene L | $92,787 | |
| Previous Owner | Shearer Grant | $107,920 | |
| Previous Owner | Landis Jason E | $94,050 |
Source: Public Records
Tax History Compared to Growth
Tax History
| Year | Tax Paid | Tax Assessment Tax Assessment Total Assessment is a certain percentage of the fair market value that is determined by local assessors to be the total taxable value of land and additions on the property. | Land | Improvement |
|---|---|---|---|---|
| 2024 | $3,636 | $62,900 | $14,830 | $48,070 |
| 2023 | $3,636 | $62,900 | $14,830 | $48,070 |
| 2022 | $2,916 | $38,590 | $9,100 | $29,490 |
| 2021 | $2,924 | $38,590 | $9,100 | $29,490 |
| 2020 | $2,922 | $38,590 | $9,100 | $29,490 |
| 2019 | $2,769 | $32,920 | $9,100 | $23,820 |
| 2018 | $2,776 | $32,920 | $9,100 | $23,820 |
| 2017 | $2,758 | $32,920 | $9,100 | $23,820 |
| 2016 | $2,769 | $32,370 | $9,100 | $23,270 |
| 2015 | $2,545 | $32,370 | $9,100 | $23,270 |
| 2014 | $2,545 | $32,370 | $9,100 | $23,270 |
| 2012 | -- | $35,470 | $9,100 | $26,370 |
Source: Public Records
Map
Nearby Homes
- 6269 Fall Gold Dr
- 6497 Burkwood Dr
- 6047 Summersweet Dr
- 5025 Willow Rd
- 1018 Redwood Rd
- Ashton Plan at Hunters Path
- Cooper Plan at Hunters Path
- Norway Plan at Hunters Path
- Juniper Plan at Hunters Path
- 1003 Redwood Rd
- Chestnut Plan at Hunters Path
- Palmetto Plan at Hunters Path
- Ironwood Plan at Hunters Path
- Spruce Plan at Hunters Path
- Aspen II Plan at Hunters Path
- Empress Plan at Hunters Path
- Bradford Plan at Hunters Path
- Walnut Plan at Hunters Path
- 1206 N Union Rd
- 2027 Ivy Rd
- 5936 Summersweet Dr
- 5916 Summersweet Dr
- 5906 Summersweet Dr
- 5946 Summersweet Dr
- 5881 Mount Royal Dr
- 5891 Mount Royal Dr
- 5871 Mount Royal Dr
- 5917 Summersweet Dr
- 5927 Summersweet Dr
- 5861 Mount Royal Dr
- 5947 Summersweet Dr
- 5907 Summersweet Dr
- 5920 Coralberry Dr
- 5930 Coralberry Dr
- 5901 Mount Royal Dr
- 5896 Summersweet Dr
- 5940 Coralberry Dr
- 5897 Summersweet Dr
- 5851 Mount Royal Dr
- 5957 Summersweet Dr