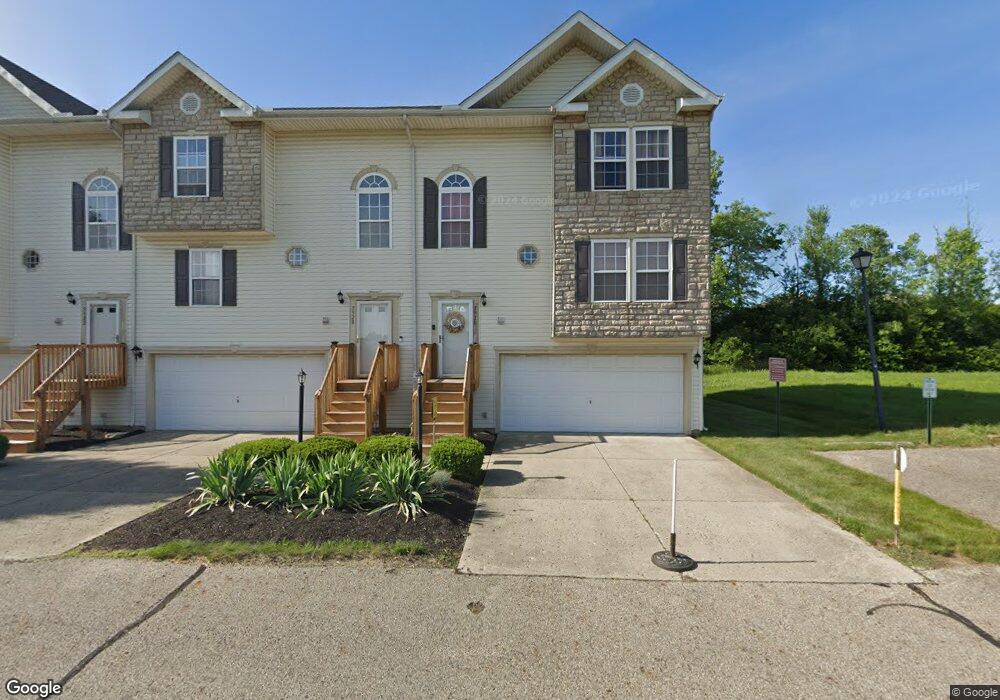
5930 Abernathy Ln Unit 17F Columbus, OH 43232
Walnut Heights NeighborhoodEstimated Value: $184,000 - $205,653
3
Beds
4
Baths
1,586
Sq Ft
$124/Sq Ft
Est. Value
About This Home
This home is located at 5930 Abernathy Ln Unit 17F, Columbus, OH 43232 and is currently estimated at $196,163, approximately $123 per square foot. 5930 Abernathy Ln Unit 17F is a home located in Franklin County with nearby schools including Groveport Madison High School, A+ Arts Academy, and Brice Christian Academy Elementary School.
Ownership History
Date
Name
Owned For
Owner Type
Purchase Details
Closed on
Dec 10, 2018
Sold by
Brown Peggi L
Bought by
Napier Sharon Lynette
Current Estimated Value
Home Financials for this Owner
Home Financials are based on the most recent Mortgage that was taken out on this home.
Original Mortgage
$89,200
Outstanding Balance
$78,744
Interest Rate
4.9%
Mortgage Type
New Conventional
Estimated Equity
$117,419
Purchase Details
Closed on
Dec 19, 2005
Sold by
Maronda Homes Of Ohio Inc
Bought by
Brown Peggie L
Home Financials for this Owner
Home Financials are based on the most recent Mortgage that was taken out on this home.
Original Mortgage
$103,500
Interest Rate
6.48%
Mortgage Type
Fannie Mae Freddie Mac
Create a Home Valuation Report for This Property
The Home Valuation Report is an in-depth analysis detailing your home's value as well as a comparison with similar homes in the area
Home Values in the Area
Average Home Value in this Area
Purchase History
| Date | Buyer | Sale Price | Title Company |
|---|---|---|---|
| Napier Sharon Lynette | $95,000 | None Available | |
| Brown Peggie L | $103,500 | Stewart Tit |
Source: Public Records
Mortgage History
| Date | Status | Borrower | Loan Amount |
|---|---|---|---|
| Open | Napier Sharon Lynette | $89,200 | |
| Previous Owner | Brown Peggie L | $103,500 |
Source: Public Records
Tax History Compared to Growth
Tax History
| Year | Tax Paid | Tax Assessment Tax Assessment Total Assessment is a certain percentage of the fair market value that is determined by local assessors to be the total taxable value of land and additions on the property. | Land | Improvement |
|---|---|---|---|---|
| 2024 | $2,045 | $58,030 | $8,750 | $49,280 |
| 2023 | $2,052 | $58,030 | $8,750 | $49,280 |
| 2022 | $1,108 | $30,700 | $4,060 | $26,640 |
| 2021 | $1,555 | $30,700 | $4,060 | $26,640 |
| 2020 | $1,557 | $30,700 | $4,060 | $26,640 |
| 2019 | $1,201 | $21,180 | $2,800 | $18,380 |
| 2018 | $1,322 | $21,180 | $2,800 | $18,380 |
| 2017 | $1,317 | $21,180 | $2,800 | $18,380 |
| 2016 | $1,421 | $22,680 | $4,340 | $18,340 |
| 2015 | $1,436 | $22,680 | $4,340 | $18,340 |
| 2014 | $1,452 | $22,680 | $4,340 | $18,340 |
| 2013 | $760 | $28,350 | $5,425 | $22,925 |
Source: Public Records
Map
Nearby Homes
- 5936 Abernathy Ln
- 5938 Abernathy Ln
- 5944 Abernathy Ln
- 5946 Abernathy Ln
- 5960 Abernathy Ln
- 5962 Abernathy Ln
- 5968 Abernathy Ln
- 5970 Abernathy Ln
- 5882 Abernathy Ln Unit 5882F
- 5976 Abernathy Ln
- 5978 Abernathy Ln
- 3298 Joshstock Dr
- 3304 Joshstock Dr
- 3310 Joshstock Dr
- St Martin Plan at Chatterton Commons
- 5957 Hollett Dr S
- 3057 Lamptonridge Dr
- 5969 Hollett Dr S
- 5987 Hollett Dr S
- 3198 Gallant Dr
- 5930 Abernathy Ln Unit 5930F
- 5928 Abernathy Ln Unit 5928E
- 5928 Abernathy Ln Unit 17E
- 5922 Abernathy Ln Unit 5922D
- 5922 Abernathy Ln Unit 17D
- 5920 Abernathy Ln Unit 5920C
- 5920 Abernathy Ln Unit 17C
- 5914 Abernathy Ln Unit 5914B
- 5914 Abernathy Ln Unit 17B
- 5912 Abernathy Ln Unit 5912A
- 5912 Abernathy Ln Unit 17A
- 5903 Damsel Dr
- 5897 Damsel Dr
- 5909 Damsel Dr
- 5891 Damsel Dr
- 5906 Abernathy Ln Unit 5906F
- 5917 Damsel Dr
- 5885 Damsel Dr
- 0 Damsel Dr
- 3260 Edinwick Way Unit 3260A