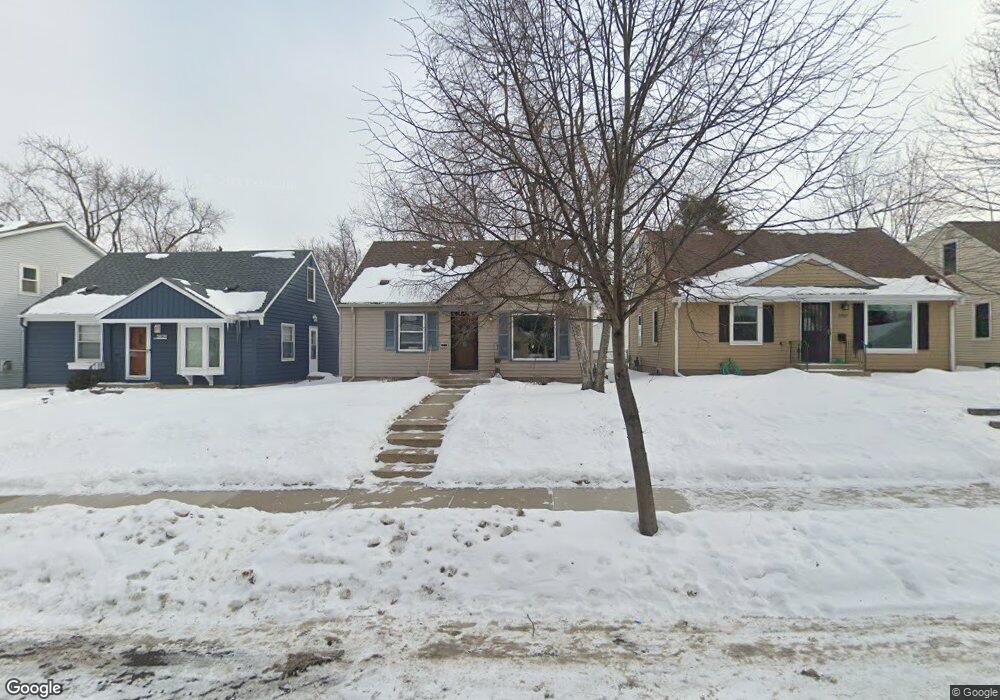
5933 Vincent Ave S Minneapolis, MN 55410
Armatage NeighborhoodEstimated Value: $414,000 - $441,000
4
Beds
2
Baths
1,830
Sq Ft
$232/Sq Ft
Est. Value
About This Home
This home is located at 5933 Vincent Ave S, Minneapolis, MN 55410 and is currently estimated at $423,979, approximately $231 per square foot. 5933 Vincent Ave S is a home located in Hennepin County with nearby schools including Armatage Elementary School, Anthony Middle School, and Southwest Senior High School.
Ownership History
Date
Name
Owned For
Owner Type
Purchase Details
Closed on
Mar 26, 2021
Sold by
Dorgan Andrew P and Dorgan Taylor
Bought by
Gunderson Brianna and Petersen Daniel
Current Estimated Value
Home Financials for this Owner
Home Financials are based on the most recent Mortgage that was taken out on this home.
Original Mortgage
$369,550
Outstanding Balance
$333,120
Interest Rate
2.9%
Mortgage Type
New Conventional
Estimated Equity
$90,859
Purchase Details
Closed on
Jun 1, 2010
Sold by
Lokkesmoe Dale Venture
Bought by
Dorgan Andrew P
Purchase Details
Closed on
Nov 9, 2007
Sold by
Supply Co
Bought by
Lokkesmoe Dale and Lokkesmoe Linda
Purchase Details
Closed on
Oct 29, 1999
Sold by
The Supply Co
Bought by
Anthenisen Charlotte R
Purchase Details
Closed on
May 8, 1997
Sold by
Carapace Corp
Bought by
Strothman Joseph M
Create a Home Valuation Report for This Property
The Home Valuation Report is an in-depth analysis detailing your home's value as well as a comparison with similar homes in the area
Home Values in the Area
Average Home Value in this Area
Purchase History
| Date | Buyer | Sale Price | Title Company |
|---|---|---|---|
| Gunderson Brianna | $399,000 | Burnet Title | |
| Dorgan Andrew P | $225,000 | -- | |
| Lokkesmoe Dale | $185,000 | -- | |
| Anthenisen Charlotte R | $115,000 | -- | |
| Strothman Joseph M | $98,463 | -- |
Source: Public Records
Mortgage History
| Date | Status | Borrower | Loan Amount |
|---|---|---|---|
| Open | Gunderson Brianna | $369,550 | |
| Closed | Strothman Joseph M | -- |
Source: Public Records
Tax History Compared to Growth
Tax History
| Year | Tax Paid | Tax Assessment Tax Assessment Total Assessment is a certain percentage of the fair market value that is determined by local assessors to be the total taxable value of land and additions on the property. | Land | Improvement |
|---|---|---|---|---|
| 2024 | $5,163 | $361,000 | $172,000 | $189,000 |
| 2023 | $4,633 | $360,000 | $172,000 | $188,000 |
| 2022 | $4,247 | $360,000 | $151,000 | $209,000 |
| 2021 | $4,360 | $314,500 | $104,000 | $210,500 |
| 2020 | $4,710 | $314,500 | $77,400 | $237,100 |
| 2019 | $4,612 | $314,500 | $68,600 | $245,900 |
| 2018 | $3,804 | $299,500 | $68,600 | $230,900 |
| 2017 | $3,469 | $239,000 | $62,400 | $176,600 |
| 2016 | $3,435 | $230,500 | $62,400 | $168,100 |
| 2015 | $3,397 | $219,000 | $62,400 | $156,600 |
| 2014 | -- | $196,500 | $59,000 | $137,500 |
Source: Public Records
Map
Nearby Homes
- 2810 W 60th St
- 5921 Xerxes Ave S
- 5818 Xerxes Ave S
- 6028 Russell Ave S
- 5728 Vincent Ave S
- 5936 Queen Ave S
- 5913 Abbott Ave S
- 5704 Washburn Ave S
- 5711 Xerxes Ave S
- 5720 Xerxes Ave S
- 6112 Zenith Ave S
- 6024 Abbott Ave S
- 5721 Abbott Ave S
- 6041 Penn Ave S
- 5608 Vincent Ave S
- 6107 Penn Ave S
- 5905 Chowen Ave S
- 6300 Xerxes Ave S Unit 31
- 5541 Upton Ave S
- 6124 Beard Ave S
- 5937 Vincent Ave S
- 5941 Vincent Ave S
- 5921 Vincent Ave S
- 5932 Upton Ave S
- 5928 Upton Ave S
- 5936 Upton Ave S
- 5917 Vincent Ave S
- 5924 Upton Ave S
- 5940 Upton Ave S
- 5920 Upton Ave S
- 2822 W 60th St
- 5932 Vincent Ave S
- 2818 W 60th St
- 2826 W 60th St
- 5928 Vincent Ave S
- 5913 Vincent Ave S
- 2814 W 60th St
- 5940 Vincent Ave S
- 5924 Vincent Ave S
- 5916 Upton Ave S