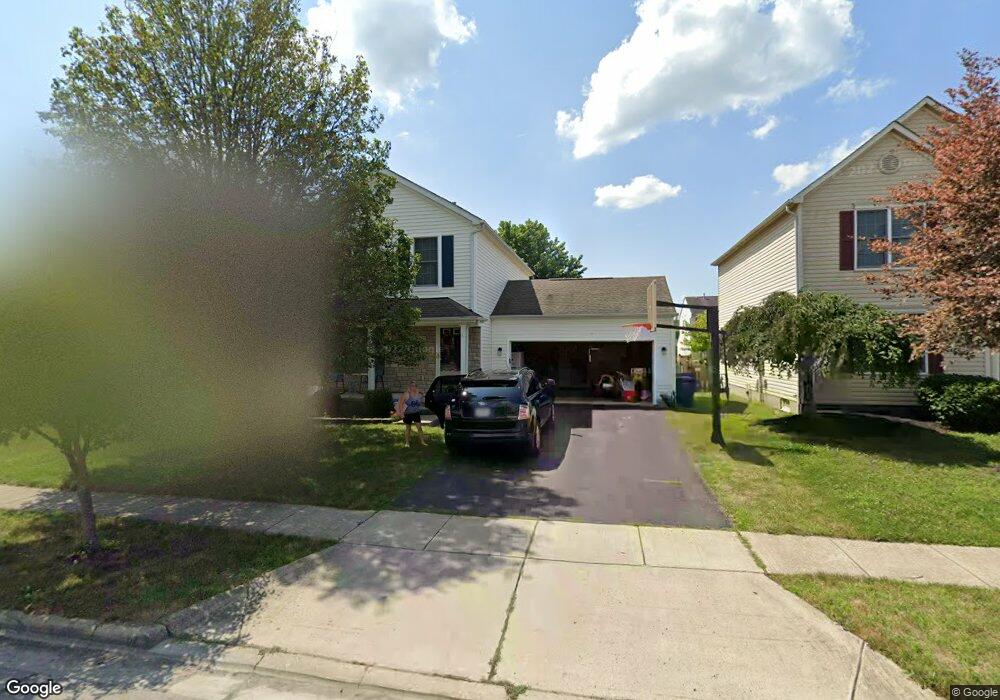
5937 Westbend Dr Galloway, OH 43119
Galloway Ridge NeighborhoodEstimated Value: $301,000 - $349,000
3
Beds
3
Baths
1,360
Sq Ft
$237/Sq Ft
Est. Value
About This Home
This home is located at 5937 Westbend Dr, Galloway, OH 43119 and is currently estimated at $322,774, approximately $237 per square foot. 5937 Westbend Dr is a home located in Franklin County with nearby schools including Galloway Ridge Intermediate School, Darby Woods Elementary School, and Norton Middle School.
Ownership History
Date
Name
Owned For
Owner Type
Purchase Details
Closed on
Sep 23, 2011
Sold by
Madzia Matthew R and Madzia Kristine M
Bought by
Watkins Philip and Watkins Maria N
Current Estimated Value
Home Financials for this Owner
Home Financials are based on the most recent Mortgage that was taken out on this home.
Original Mortgage
$115,425
Outstanding Balance
$78,588
Interest Rate
4.14%
Mortgage Type
New Conventional
Estimated Equity
$244,186
Purchase Details
Closed on
Sep 26, 2008
Sold by
Toh Woon Huey and Lam Chen Quin
Bought by
Madzia Matthew R and Madzia Kristine M
Home Financials for this Owner
Home Financials are based on the most recent Mortgage that was taken out on this home.
Original Mortgage
$127,988
Interest Rate
6.57%
Mortgage Type
FHA
Purchase Details
Closed on
Jun 11, 2002
Sold by
Dominion Homes Inc
Bought by
Toh Woon Huey and Lam Chen Quin
Home Financials for this Owner
Home Financials are based on the most recent Mortgage that was taken out on this home.
Original Mortgage
$159,328
Interest Rate
6.87%
Mortgage Type
FHA
Create a Home Valuation Report for This Property
The Home Valuation Report is an in-depth analysis detailing your home's value as well as a comparison with similar homes in the area
Home Values in the Area
Average Home Value in this Area
Purchase History
| Date | Buyer | Sale Price | Title Company |
|---|---|---|---|
| Watkins Philip | $119,000 | Talon | |
| Madzia Matthew R | $129,000 | Quality Choice Title | |
| Toh Woon Huey | $161,000 | Alliance Title |
Source: Public Records
Mortgage History
| Date | Status | Borrower | Loan Amount |
|---|---|---|---|
| Open | Watkins Philip | $115,425 | |
| Previous Owner | Madzia Matthew R | $127,988 | |
| Previous Owner | Toh Woon Huey | $159,328 |
Source: Public Records
Tax History Compared to Growth
Tax History
| Year | Tax Paid | Tax Assessment Tax Assessment Total Assessment is a certain percentage of the fair market value that is determined by local assessors to be the total taxable value of land and additions on the property. | Land | Improvement |
|---|---|---|---|---|
| 2024 | $3,318 | $91,000 | $27,580 | $63,420 |
| 2023 | $3,259 | $91,000 | $27,580 | $63,420 |
| 2022 | $2,721 | $55,760 | $9,240 | $46,520 |
| 2021 | $2,776 | $55,760 | $9,240 | $46,520 |
| 2020 | $2,760 | $55,760 | $9,240 | $46,520 |
| 2019 | $2,623 | $46,760 | $7,700 | $39,060 |
| 2018 | $2,563 | $46,760 | $7,700 | $39,060 |
| 2017 | $2,557 | $46,760 | $7,700 | $39,060 |
| 2016 | $2,516 | $41,580 | $6,440 | $35,140 |
| 2015 | $2,516 | $41,580 | $6,440 | $35,140 |
| 2014 | $2,518 | $41,580 | $6,440 | $35,140 |
| 2013 | $1,315 | $43,785 | $6,790 | $36,995 |
Source: Public Records
Map
Nearby Homes
- 5819 Katara Dr
- 5946 Wellbrid Dr
- Crisfield Plan at Clover Run
- Oakdale Plan at Clover Run
- Aspire Plan at Clover Run
- Hampton Plan at Clover Run
- Mitchell Plan at Clover Run
- Fairview Plan at Clover Run
- 6029 Treaty Ln Unit 222
- 159 Yehlshire Dr
- 378 Millett Dr
- 198 Yehlshire Dr
- 5688 Larksdale Dr
- 6076 Federalist Dr Unit 144
- 469 Ruffin Dr
- 5843 Tully Cross Dr
- 242 Rockbrook Crossing Ave
- 244 Fortune Dr Unit Lot 43
- 272 Rye St Unit Lot 44
- 712 Cape Henry Dr
- 5943 Westbend Dr
- 5931 Westbend Dr
- 5949 Westbend Dr
- 5925 Westbend Dr
- 5942 Weston Woods Dr
- 5936 Weston Woods Dr
- 5936 Weston Woods Dr Unit 302
- 5930 Weston Woods Dr
- 5955 Westbend Dr
- 5938 Westbend Dr
- 5954 Weston Woods Dr
- 5919 Westbend Dr
- 5924 Weston Woods Dr
- 5946 Westbend Dr
- 5961 Westbend Dr
- 5960 Weston Woods Dr
- 5926 Westbend Dr
- 5954 Westbend Dr
- 5954 Westbend Dr Unit 369
- 5918 Weston Woods Dr