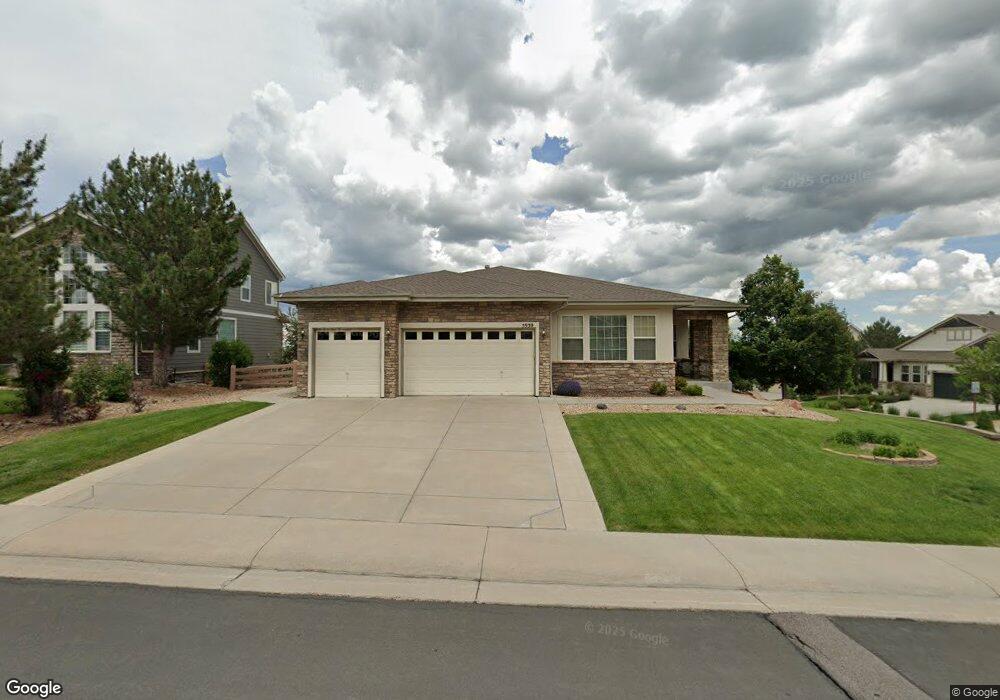
5939 Bridle Path Ln Parker, CO 80134
The Pinery NeighborhoodEstimated Value: $943,000 - $1,079,000
4
Beds
4
Baths
5,718
Sq Ft
$178/Sq Ft
Est. Value
About This Home
This home is located at 5939 Bridle Path Ln, Parker, CO 80134 and is currently estimated at $1,020,167, approximately $178 per square foot. 5939 Bridle Path Ln is a home located in Douglas County with nearby schools including Mountain View Elementary School, Northeast Elementary School, and Sagewood Middle School.
Ownership History
Date
Name
Owned For
Owner Type
Purchase Details
Closed on
Dec 28, 2011
Sold by
Capps Johnson Betty J
Bought by
Hall Brenda Anne and Hall Christopher David
Current Estimated Value
Home Financials for this Owner
Home Financials are based on the most recent Mortgage that was taken out on this home.
Original Mortgage
$357,600
Outstanding Balance
$276,562
Interest Rate
7.23%
Mortgage Type
Adjustable Rate Mortgage/ARM
Estimated Equity
$743,605
Purchase Details
Closed on
May 17, 2010
Sold by
Capps Johnson Betty J
Bought by
Capps Johnson Betty J
Purchase Details
Closed on
Jan 27, 2005
Sold by
Kdb Homes Inc
Bought by
Johnson Lawrence R and Capps Johnson Betty J
Home Financials for this Owner
Home Financials are based on the most recent Mortgage that was taken out on this home.
Original Mortgage
$384,500
Interest Rate
5.25%
Mortgage Type
New Conventional
Create a Home Valuation Report for This Property
The Home Valuation Report is an in-depth analysis detailing your home's value as well as a comparison with similar homes in the area
Home Values in the Area
Average Home Value in this Area
Purchase History
We collect this data history from publicly available records. To have your information removed, we recommend requesting removal directly through your county’s website.
| Date | Buyer | Sale Price | Title Company |
|---|---|---|---|
| Hall Brenda Anne | $447,000 | Guardian Title | |
| Capps Johnson Betty J | -- | None Available | |
| Johnson Lawrence R | $480,667 | Fahtco |
Source: Public Records
Mortgage History
We collect this data history from publicly available records. To have your information removed, we recommend requesting removal directly through your county’s website.
| Date | Status | Borrower | Loan Amount |
|---|---|---|---|
| Open | Hall Brenda Anne | $357,600 | |
| Previous Owner | Johnson Lawrence R | $384,500 |
Source: Public Records
Tax History
| Year | Tax Paid | Tax Assessment Tax Assessment Total Assessment is a certain percentage of the fair market value that is determined by local assessors to be the total taxable value of land and additions on the property. | Land | Improvement |
|---|---|---|---|---|
| 2025 | $7,935 | $67,190 | $15,150 | $52,040 |
| 2024 | $7,935 | $68,670 | $12,500 | $56,170 |
| 2023 | $8,125 | $68,670 | $12,500 | $56,170 |
| 2022 | $7,044 | $51,330 | $8,080 | $43,250 |
| 2021 | $7,094 | $51,330 | $8,080 | $43,250 |
| 2020 | $6,524 | $48,400 | $8,670 | $39,730 |
| 2019 | $6,544 | $48,400 | $8,670 | $39,730 |
| 2018 | $6,124 | $44,790 | $7,930 | $36,860 |
| 2017 | $5,856 | $44,790 | $7,930 | $36,860 |
| 2016 | $6,215 | $46,040 | $5,970 | $40,070 |
| 2015 | $6,532 | $46,040 | $5,970 | $40,070 |
| 2014 | $5,809 | $39,310 | $4,380 | $34,930 |
Source: Public Records
Map
Nearby Homes
- 5923 Bridle Path Ln
- 4993 Wagontrail Ct
- 5127 Mining Camp Trail
- 5290 Spur Cross Trail
- 5509 Sawdust Loop
- 5477 Spur Cross Trail
- 5257 Moonlight Way
- 5791 Chisholm Place
- 6196 Westview Cir
- 5369 Hospitality Place
- 6726 Lynch Ln
- 7287 Greenwater Cir
- 6297 Old Divide Trail
- 4735 Desperado Way
- 5165 Rialto Dr
- 5220 Rialto Dr
- 5704 Distant View Place
- 6522 Lynch Ln
- 7408 Greenwater Cir
- 5615 Vistancia Dr
- 5922 Bridle Path Ln
- 5938 Bridle Path Ln
- 5891 Bridle Path Ln
- 5906 Bridle Path Ln
- 5885 Bridle Path Ln
- 5890 Bridle Path Ln
- 4950 Streambed Trail
- 4960 Streambed Trail
- 4970 Streambed Trail
- 5954 Lasso Place
- 5882 Bridle Path Ln
- 5879 Bridle Path Ln
- 4940 Streambed Trail
- 5878 Bridle Path Ln
- 5934 Lasso Place
- 4924 Streambed Trail
- 4901 Streambed Trail
- 5978 Lasso Place
- 5918 Lasso Place
- 4914 Streambed Trail
Your Personal Tour Guide
Ask me questions while you tour the home.