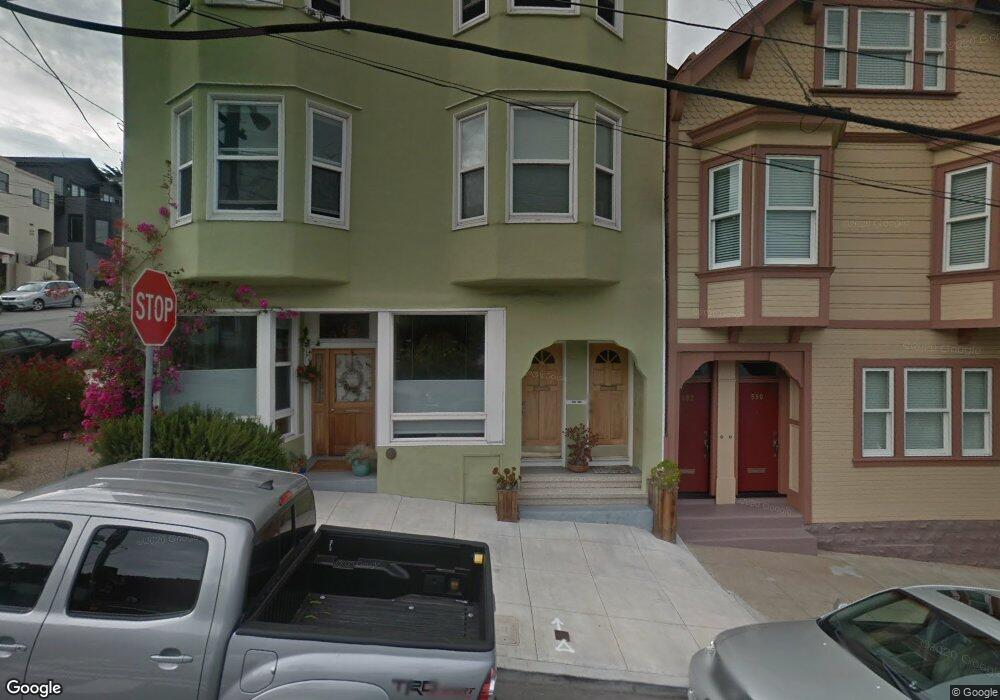
594 29th St San Francisco, CA 94131
Noe Valley NeighborhoodEstimated Value: $1,090,000 - $1,344,676
2
Beds
2
Baths
1,338
Sq Ft
$920/Sq Ft
Est. Value
About This Home
This home is located at 594 29th St, San Francisco, CA 94131 and is currently estimated at $1,230,419, approximately $919 per square foot. 594 29th St is a home located in San Francisco County with nearby schools including Alvarado Elementary, James Lick Middle School, and St. Philip School.
Ownership History
Date
Name
Owned For
Owner Type
Purchase Details
Closed on
Aug 5, 2010
Sold by
Lemmo Kevin J and Britton Cassandra L
Bought by
Norton Sean M and Norton Abigail K
Current Estimated Value
Home Financials for this Owner
Home Financials are based on the most recent Mortgage that was taken out on this home.
Original Mortgage
$652,800
Outstanding Balance
$431,126
Interest Rate
4.52%
Mortgage Type
New Conventional
Estimated Equity
$799,293
Purchase Details
Closed on
Dec 16, 2005
Sold by
Delsecco Julie
Bought by
Lamber David S and Lambert Irena
Home Financials for this Owner
Home Financials are based on the most recent Mortgage that was taken out on this home.
Original Mortgage
$1,120,000
Interest Rate
5.5%
Mortgage Type
Fannie Mae Freddie Mac
Create a Home Valuation Report for This Property
The Home Valuation Report is an in-depth analysis detailing your home's value as well as a comparison with similar homes in the area
Home Values in the Area
Average Home Value in this Area
Purchase History
| Date | Buyer | Sale Price | Title Company |
|---|---|---|---|
| Norton Sean M | $768,000 | Fidelity National Title Co | |
| Lamber David S | $1,400,000 | First American Title Company |
Source: Public Records
Mortgage History
| Date | Status | Borrower | Loan Amount |
|---|---|---|---|
| Open | Norton Sean M | $652,800 | |
| Previous Owner | Lamber David S | $1,120,000 |
Source: Public Records
Tax History Compared to Growth
Tax History
| Year | Tax Paid | Tax Assessment Tax Assessment Total Assessment is a certain percentage of the fair market value that is determined by local assessors to be the total taxable value of land and additions on the property. | Land | Improvement |
|---|---|---|---|---|
| 2025 | $12,327 | $1,011,765 | $590,362 | $421,403 |
| 2024 | $12,327 | $991,928 | $578,787 | $413,141 |
| 2023 | $12,136 | $972,480 | $567,439 | $405,041 |
| 2022 | $11,898 | $953,413 | $556,313 | $397,100 |
| 2021 | $11,684 | $934,719 | $545,405 | $389,314 |
| 2020 | $11,744 | $925,136 | $539,813 | $385,323 |
| 2019 | $11,341 | $906,997 | $529,229 | $377,768 |
| 2018 | $10,959 | $889,214 | $518,852 | $370,362 |
| 2017 | $10,530 | $871,780 | $508,679 | $363,101 |
| 2016 | $10,348 | $854,687 | $498,705 | $355,982 |
| 2015 | $10,218 | $841,850 | $491,214 | $350,636 |
| 2014 | $9,948 | $825,361 | $481,592 | $343,769 |
Source: Public Records
Map
Nearby Homes