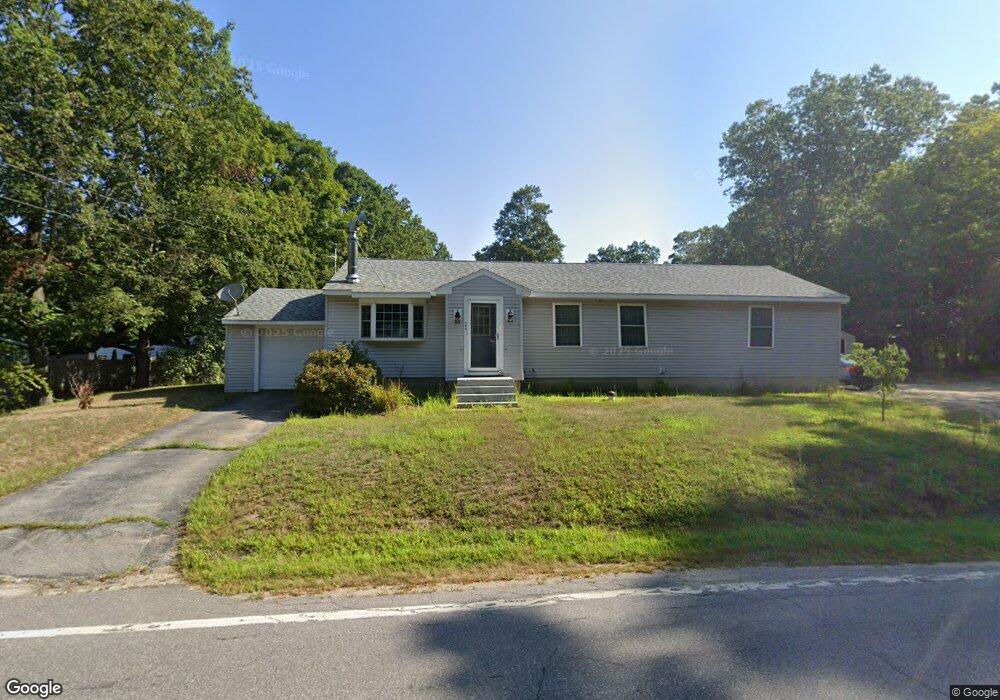
594 Main St Fremont, NH 03044
Estimated Value: $463,000 - $516,378
2
Beds
1
Bath
925
Sq Ft
$531/Sq Ft
Est. Value
About This Home
This home is located at 594 Main St, Fremont, NH 03044 and is currently estimated at $491,095, approximately $530 per square foot. 594 Main St is a home located in Rockingham County with nearby schools including Ellis School.
Ownership History
Date
Name
Owned For
Owner Type
Purchase Details
Closed on
Aug 31, 2005
Sold by
Beaupre Keith T and Beaupre Linda
Bought by
Griffith Kevin L
Current Estimated Value
Home Financials for this Owner
Home Financials are based on the most recent Mortgage that was taken out on this home.
Original Mortgage
$234,900
Outstanding Balance
$49,703
Interest Rate
5.81%
Estimated Equity
$441,392
Purchase Details
Closed on
Apr 30, 1998
Sold by
Gelinas Timothy P and Gelinas Cynthia A
Bought by
Beaupre Keith T and Beaupre Linda
Home Financials for this Owner
Home Financials are based on the most recent Mortgage that was taken out on this home.
Original Mortgage
$50,000
Interest Rate
7.04%
Create a Home Valuation Report for This Property
The Home Valuation Report is an in-depth analysis detailing your home's value as well as a comparison with similar homes in the area
Home Values in the Area
Average Home Value in this Area
Purchase History
| Date | Buyer | Sale Price | Title Company |
|---|---|---|---|
| Griffith Kevin L | $234,900 | -- | |
| Beaupre Keith T | $113,900 | -- |
Source: Public Records
Mortgage History
| Date | Status | Borrower | Loan Amount |
|---|---|---|---|
| Open | Griffith Kevin L | $234,900 | |
| Closed | Beaupre Keith T | $234,900 | |
| Previous Owner | Beaupre Keith T | $50,000 |
Source: Public Records
Tax History Compared to Growth
Tax History
| Year | Tax Paid | Tax Assessment Tax Assessment Total Assessment is a certain percentage of the fair market value that is determined by local assessors to be the total taxable value of land and additions on the property. | Land | Improvement |
|---|---|---|---|---|
| 2024 | $7,439 | $282,100 | $90,200 | $191,900 |
| 2023 | $6,655 | $282,100 | $90,200 | $191,900 |
| 2022 | $6,542 | $282,100 | $90,200 | $191,900 |
| 2021 | $6,296 | $282,100 | $90,200 | $191,900 |
| 2020 | $6,525 | $282,100 | $90,200 | $191,900 |
| 2019 | $6,561 | $211,300 | $76,800 | $134,500 |
| 2018 | $6,227 | $211,800 | $76,800 | $135,000 |
| 2017 | $6,182 | $211,800 | $76,800 | $135,000 |
| 2016 | $6,329 | $211,800 | $76,800 | $135,000 |
| 2015 | $6,142 | $211,800 | $76,800 | $135,000 |
| 2014 | $4,656 | $165,000 | $76,800 | $88,200 |
| 2013 | $4,698 | $164,800 | $76,800 | $88,000 |
Source: Public Records
Map
Nearby Homes
- 564 Main St
- 60 Copp Dr
- 98 Copp Dr
- 454 Main St
- 94 Thunder Rd
- 245 Danville Rd
- 8 Taylor Cir Unit 12
- 54 Cavil Mill Rd
- 38 Bluefish Dr
- 308 Main St
- Lot 7-3 Sanborn Meadow Unit 7-3
- Lot 7-0 Sanborn Meadow Unit 7-0
- Lot 7-2 Sanborn Meadow Unit 7-2
- 30 Tibbetts Rd
- 24 Rim Rd
- 12 Hub Hollow Rd
- 45 Whittier Dr
- 240 Main St
- 14 River Rd
- 70 Sandown Rd