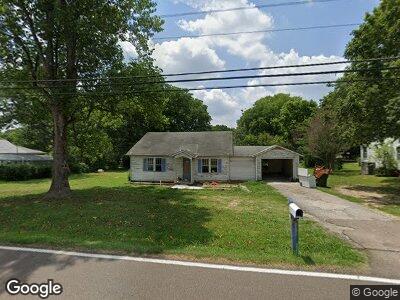
5940 Main St E Trezevant, TN 38258
Estimated Value: $52,833 - $148,000
--
Bed
1
Bath
982
Sq Ft
$103/Sq Ft
Est. Value
About This Home
This home is located at 5940 Main St E, Trezevant, TN 38258 and is currently estimated at $101,208, approximately $103 per square foot. 5940 Main St E is a home located in Carroll County with nearby schools including West Carroll Primary School, West Carroll Elementary School, and West Carroll Junior/Senior High School.
Ownership History
Date
Name
Owned For
Owner Type
Purchase Details
Closed on
May 4, 2021
Sold by
Dempsey Februlina G Manz
Bought by
Dempsey Jeremy
Current Estimated Value
Purchase Details
Closed on
Jul 9, 2018
Sold by
Finch Chrismon Julydia L D
Bought by
Manz Februlina G
Purchase Details
Closed on
Feb 19, 2018
Sold by
Finch Phillip
Bought by
Manz Februlina G
Purchase Details
Closed on
Aug 6, 2010
Sold by
Erwin Donnie
Bought by
Finch Phillip W
Home Financials for this Owner
Home Financials are based on the most recent Mortgage that was taken out on this home.
Original Mortgage
$24,132
Interest Rate
4.6%
Mortgage Type
New Conventional
Purchase Details
Closed on
Oct 29, 2009
Sold by
Camper Marty D
Bought by
Erwin Donnie
Purchase Details
Closed on
Feb 24, 2006
Sold by
Camper Marty D
Bought by
Camper Marty D
Purchase Details
Closed on
Apr 20, 1968
Bought by
Camper Hazel
Create a Home Valuation Report for This Property
The Home Valuation Report is an in-depth analysis detailing your home's value as well as a comparison with similar homes in the area
Home Values in the Area
Average Home Value in this Area
Purchase History
| Date | Buyer | Sale Price | Title Company |
|---|---|---|---|
| Dempsey Jeremy | -- | None Available | |
| Manz Februlina G | -- | -- | |
| Manz Februlina G | -- | -- | |
| Finch Phillip W | $28,000 | -- | |
| Erwin Donnie | $25,500 | -- | |
| Camper Marty D | -- | -- | |
| Camper Hazel | -- | -- |
Source: Public Records
Mortgage History
| Date | Status | Borrower | Loan Amount |
|---|---|---|---|
| Previous Owner | Finch Phillip | $61,221 | |
| Previous Owner | Finch Phillip W | $24,132 | |
| Previous Owner | Camper Marty D | $40,000 |
Source: Public Records
Tax History Compared to Growth
Tax History
| Year | Tax Paid | Tax Assessment Tax Assessment Total Assessment is a certain percentage of the fair market value that is determined by local assessors to be the total taxable value of land and additions on the property. | Land | Improvement |
|---|---|---|---|---|
| 2024 | $321 | $9,775 | $1,500 | $8,275 |
| 2023 | $321 | $9,775 | $1,500 | $8,275 |
| 2022 | $321 | $9,775 | $1,500 | $8,275 |
| 2021 | $202 | $9,775 | $1,500 | $8,275 |
| 2020 | $321 | $9,775 | $1,500 | $8,275 |
| 2019 | $309 | $8,550 | $1,500 | $7,050 |
| 2018 | $309 | $8,550 | $1,500 | $7,050 |
| 2017 | $309 | $8,550 | $1,500 | $7,050 |
| 2016 | $424 | $8,550 | $1,500 | $7,050 |
| 2015 | $317 | $8,550 | $1,500 | $7,050 |
| 2014 | $327 | $8,550 | $1,500 | $7,050 |
| 2013 | $327 | $8,654 | $0 | $0 |
Source: Public Records
Map
Nearby Homes
- 45 Johnson St
- 290 Hurt St
- 0 Broad St S
- 160 Peggy Ln
- 13600 Church St
- 383 Big Buck Rd
- 0 Jax Rd
- 5190 Clay Farm Rd
- 1570 Mccullough Rd
- 675 Pilgrims Rest Rd
- 1946 Independence Rd
- 1810 Hinkledale Rd
- 0 Bluebird Ln
- 00 Bluebird Ln
- 396 Windy Pines Ln
- 0 Windy Pines Ln Unit 2501569
- 5935 Old Stage Rd
- 10875 Tennessee 77
- 512 W Mitchell Rd
- 45 Sydnor Rd