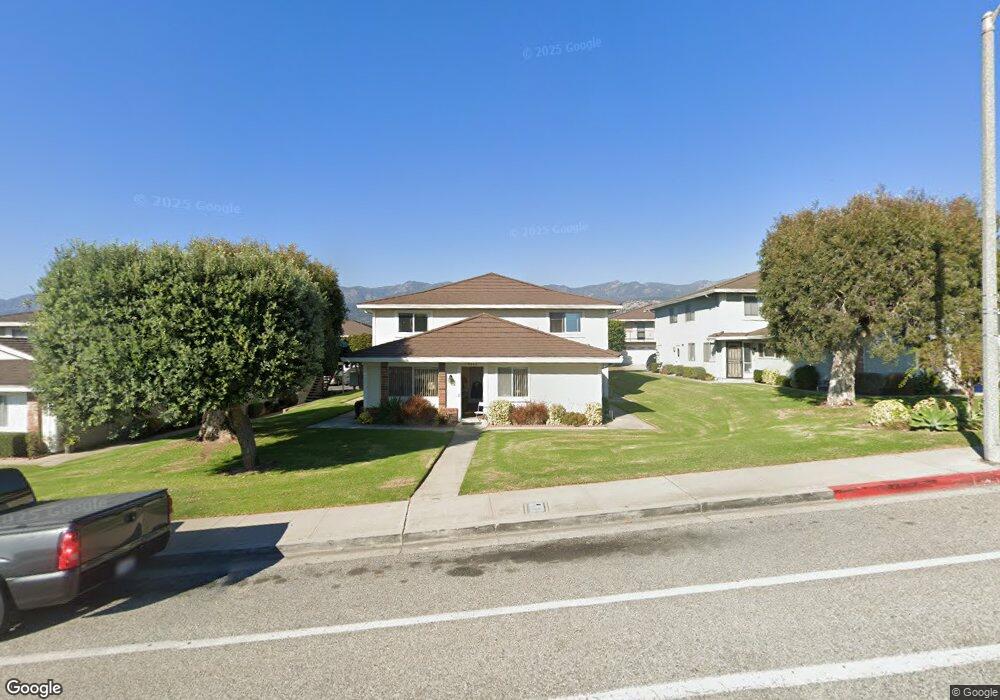
5940 Via Real Unit 1 Carpinteria, CA 93013
Estimated Value: $639,101 - $706,000
2
Beds
1
Bath
837
Sq Ft
$801/Sq Ft
Est. Value
About This Home
This home is located at 5940 Via Real Unit 1, Carpinteria, CA 93013 and is currently estimated at $670,275, approximately $800 per square foot. 5940 Via Real Unit 1 is a home located in Santa Barbara County with nearby schools including Carpinteria Senior High School, The Howard School, and Cate School.
Ownership History
Date
Name
Owned For
Owner Type
Purchase Details
Closed on
Apr 12, 2016
Sold by
Cirillo Dominick J
Bought by
Cirillo Dominick J
Current Estimated Value
Purchase Details
Closed on
Mar 8, 2001
Sold by
Hubina William S
Bought by
Cirillo Dominick J
Home Financials for this Owner
Home Financials are based on the most recent Mortgage that was taken out on this home.
Original Mortgage
$173,250
Outstanding Balance
$62,849
Interest Rate
6.97%
Estimated Equity
$607,426
Purchase Details
Closed on
Feb 12, 1999
Sold by
Witmer James L and Witmer Lucy A
Bought by
Hubina William S
Home Financials for this Owner
Home Financials are based on the most recent Mortgage that was taken out on this home.
Original Mortgage
$120,000
Interest Rate
6.7%
Mortgage Type
Seller Take Back
Create a Home Valuation Report for This Property
The Home Valuation Report is an in-depth analysis detailing your home's value as well as a comparison with similar homes in the area
Home Values in the Area
Average Home Value in this Area
Purchase History
| Date | Buyer | Sale Price | Title Company |
|---|---|---|---|
| Cirillo Dominick J | -- | None Available | |
| Cirillo Dominick J | $225,000 | Stewart Title | |
| Hubina William S | -- | Equity Title Company |
Source: Public Records
Mortgage History
| Date | Status | Borrower | Loan Amount |
|---|---|---|---|
| Open | Cirillo Dominick J | $173,250 | |
| Previous Owner | Hubina William S | $120,000 |
Source: Public Records
Tax History Compared to Growth
Tax History
| Year | Tax Paid | Tax Assessment Tax Assessment Total Assessment is a certain percentage of the fair market value that is determined by local assessors to be the total taxable value of land and additions on the property. | Land | Improvement |
|---|---|---|---|---|
| 2025 | $4,325 | $339,017 | $165,742 | $173,275 |
| 2023 | $4,325 | $325,855 | $159,307 | $166,548 |
| 2022 | $4,158 | $319,467 | $156,184 | $163,283 |
| 2021 | $4,061 | $313,204 | $153,122 | $160,082 |
| 2020 | $4,000 | $309,993 | $151,552 | $158,441 |
| 2019 | $3,908 | $303,916 | $148,581 | $155,335 |
| 2018 | $3,831 | $297,958 | $145,668 | $152,290 |
| 2017 | $3,750 | $292,116 | $142,812 | $149,304 |
| 2016 | $3,684 | $286,389 | $140,012 | $146,377 |
| 2015 | $3,649 | $282,088 | $137,909 | $144,179 |
| 2014 | $3,446 | $276,563 | $135,208 | $141,355 |
Source: Public Records
Map
Nearby Homes
- 5976 Hickory St Unit 4
- 5940 Birch St Unit 2
- 5950 Birch St Unit 2
- 6180 Via Real Unit 52
- 5700 Via Real Unit 138
- 5700 Via Real Unit 75
- 5510 Callejon
- 5455 8th St Unit 95
- 1090 Vallecito Rd
- 6660 Gobernador Canyon Rd
- 0 Gobernador Canyon Rd
- 5161 7th St
- 5366 Foothill Rd
- 4886 Sawyer Ave
- 5081 Alvarado St
- 1405 Limu Dr
- 4980 Sandyland Rd Unit 104
- 4980 Sandyland Rd
- 4980 Sandyland Rd Unit 203
- 5021 Alvarado St
- 5940 Via Real Unit 4
- 5940 Via Real Unit 3
- 5940 Via Real Unit 2
- 5940 Via Real #4 Unit 4
- 5946 Via Real Unit 4
- 5946 Via Real Unit 3
- 5946 Via Real Unit 2
- 5936 Via Real Unit 2
- 5936 Via Real Unit 4
- 5936 Via Real
- 5936 Via Real
- 5936 Via Real
- 5936 Via Real
- 5936 Via Real Unit 4
- 5936 Via Real Unit 3
- 5936 Via Real Unit 2
- 5936 Via Real Unit 1
- 5936 Via Real #4 Unit 4
- 5936 Via Real #3 Unit 3