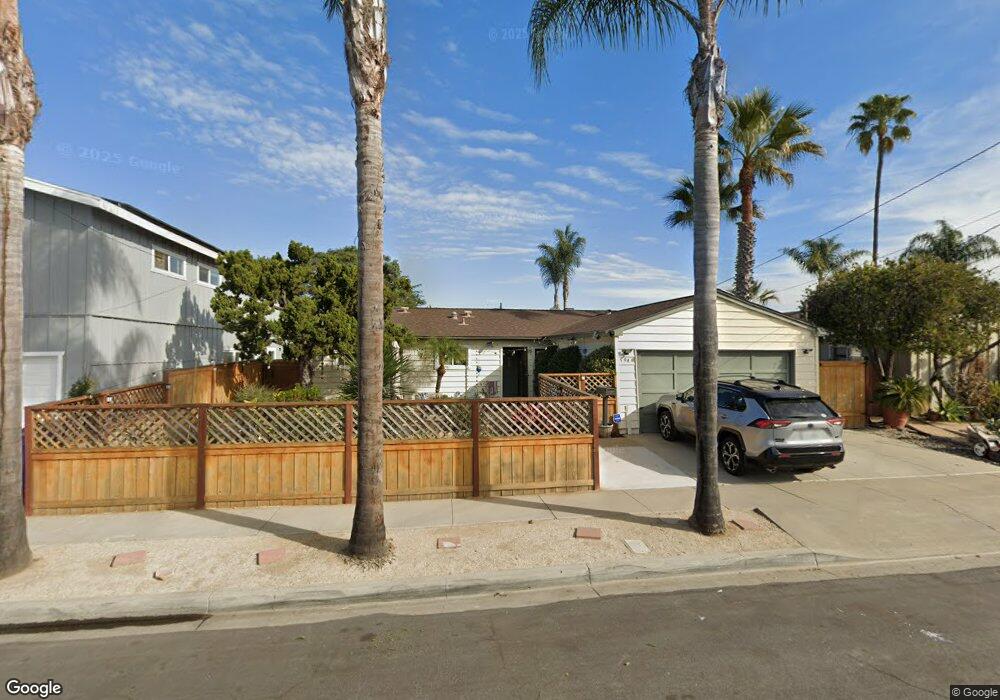
5948 Charing St San Diego, CA 92117
Clairemont Mesa East NeighborhoodEstimated Value: $986,188 - $1,342,000
3
Beds
2
Baths
1,225
Sq Ft
$941/Sq Ft
Est. Value
About This Home
This home is located at 5948 Charing St, San Diego, CA 92117 and is currently estimated at $1,152,797, approximately $941 per square foot. 5948 Charing St is a home located in San Diego County with nearby schools including Lafayette Elementary, Innovation Middle School, and Madison High School.
Ownership History
Date
Name
Owned For
Owner Type
Purchase Details
Closed on
Nov 19, 2018
Sold by
Keperling Bradley M and Keperling Michelle M
Bought by
Keperling Bradley M and Keperling Michelle M
Current Estimated Value
Purchase Details
Closed on
Sep 2, 2014
Sold by
Brown Linda M
Bought by
Keperling Michelle and Keperling Brad
Home Financials for this Owner
Home Financials are based on the most recent Mortgage that was taken out on this home.
Original Mortgage
$242,000
Outstanding Balance
$184,787
Interest Rate
4.07%
Mortgage Type
New Conventional
Estimated Equity
$968,011
Purchase Details
Closed on
Sep 6, 2002
Sold by
Brown Linda M
Bought by
Brown Linda M
Home Financials for this Owner
Home Financials are based on the most recent Mortgage that was taken out on this home.
Original Mortgage
$225,000
Interest Rate
5.72%
Mortgage Type
New Conventional
Purchase Details
Closed on
Sep 19, 1986
Create a Home Valuation Report for This Property
The Home Valuation Report is an in-depth analysis detailing your home's value as well as a comparison with similar homes in the area
Home Values in the Area
Average Home Value in this Area
Purchase History
| Date | Buyer | Sale Price | Title Company |
|---|---|---|---|
| Keperling Bradley M | -- | None Available | |
| Keperling Bradley M | -- | None Available | |
| Keperling Michelle | $512,000 | Stewart Title Of Ca Inc | |
| Brown Linda M | -- | Multiple | |
| -- | $118,000 | -- |
Source: Public Records
Mortgage History
| Date | Status | Borrower | Loan Amount |
|---|---|---|---|
| Open | Keperling Michelle | $242,000 | |
| Previous Owner | Brown Linda M | $225,000 |
Source: Public Records
Tax History Compared to Growth
Tax History
| Year | Tax Paid | Tax Assessment Tax Assessment Total Assessment is a certain percentage of the fair market value that is determined by local assessors to be the total taxable value of land and additions on the property. | Land | Improvement |
|---|---|---|---|---|
| 2025 | $7,358 | $615,336 | $192,105 | $423,231 |
| 2024 | $7,358 | $603,272 | $188,339 | $414,933 |
| 2023 | $7,194 | $591,445 | $184,647 | $406,798 |
| 2022 | $7,001 | $579,849 | $181,027 | $398,822 |
| 2021 | $6,951 | $568,480 | $177,478 | $391,002 |
| 2020 | $6,866 | $562,652 | $175,659 | $386,993 |
| 2019 | $6,743 | $551,620 | $172,215 | $379,405 |
| 2018 | $6,385 | $540,805 | $168,839 | $371,966 |
| 2017 | $6,233 | $530,202 | $165,529 | $364,673 |
| 2016 | $6,134 | $519,807 | $162,284 | $357,523 |
| 2015 | $6,043 | $512,000 | $159,847 | $352,153 |
| 2014 | $2,163 | $187,904 | $58,664 | $129,240 |
Source: Public Records
Map
Nearby Homes
- 5783 Camber Dr
- 5768 Camber Dr
- 4261 Cannington Dr
- 6602 Beadnell Way Unit 13
- 5715 Castleton Dr
- 6666 Beadnell Way Unit 9
- 6666 Beadnell Way Unit 15
- 6750 Beadnell Way Unit 3
- 5656 Chandler Dr
- 6333 Mount Ada Rd Unit 278
- 6333 Mount Ada Rd Unit 258
- 6333 Mount Ada Rd Unit 156
- 6333 Mount Ada Rd Unit 183
- 4410 Charger Blvd
- 5402 Balboa Arms Dr Unit 345
- 6535 Mount Albertine Ct
- 6939 Bettyhill Dr
- 5404 Balboa Arms Dr Unit 461
- 5252 Balboa Arms Dr Unit 180
- 5252 Balboa Arms Dr Unit 171
- 5962 Charing St
- 5936 Charing St
- 5974 Charing St
- 5947 Bakewell St
- 5920 Charing St
- 5967 Bakewell St
- 4345 Charing Place
- 5943 Charing St
- 5955 Charing St
- 5931 Charing St
- 5982 Charing St
- 4326 Chelford St
- 4351 Charing Place
- 5967 Charing St
- 5919 Charing St
- 5979 Charing St
- 4338 Chelford St
- 5977 Bakewell St
- 4322 Charing Place
- 4308 Charing Place