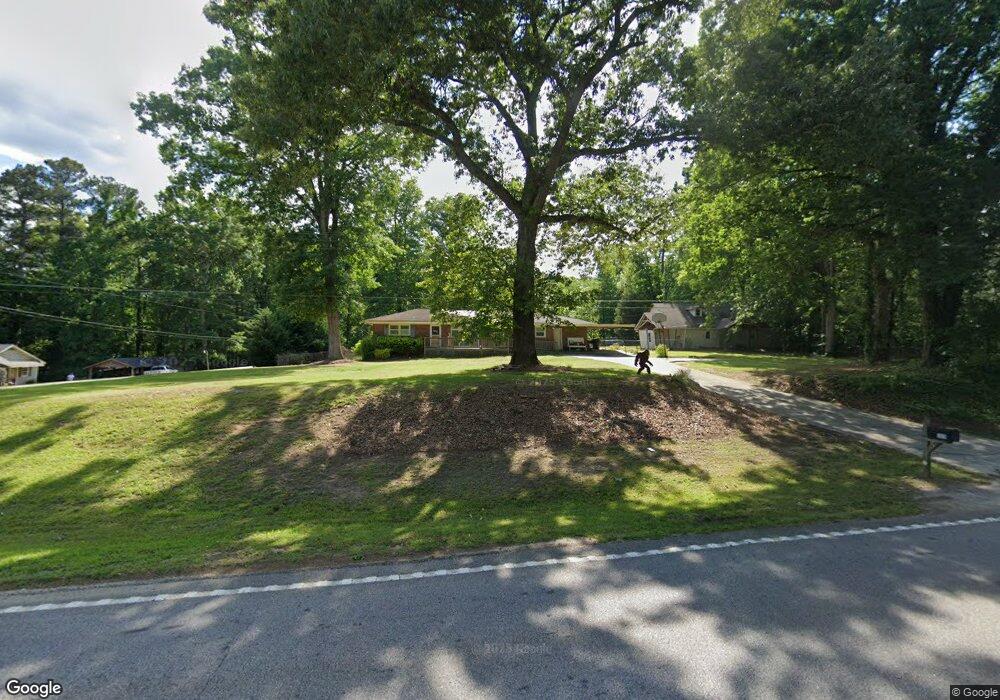
5949 Highway 155 N Stockbridge, GA 30281
Estimated Value: $189,000 - $269,000
3
Beds
2
Baths
1,652
Sq Ft
$146/Sq Ft
Est. Value
About This Home
This home is located at 5949 Highway 155 N, Stockbridge, GA 30281 and is currently estimated at $240,409, approximately $145 per square foot. 5949 Highway 155 N is a home located in Henry County with nearby schools including Austin Road Elementary School, Austin Road Middle School, and Woodland High School.
Ownership History
Date
Name
Owned For
Owner Type
Purchase Details
Closed on
Jan 13, 2022
Sold by
Hicks Sonya
Bought by
Hicks Justin Paul
Current Estimated Value
Home Financials for this Owner
Home Financials are based on the most recent Mortgage that was taken out on this home.
Original Mortgage
$105,000
Interest Rate
2.43%
Mortgage Type
New Conventional
Purchase Details
Closed on
Mar 4, 2016
Sold by
Thomas Robert Todd
Bought by
Hicks Sonya
Home Financials for this Owner
Home Financials are based on the most recent Mortgage that was taken out on this home.
Original Mortgage
$22,311
Interest Rate
3.72%
Mortgage Type
New Conventional
Purchase Details
Closed on
Oct 24, 2012
Sold by
Hrinko Vicky
Bought by
Thomas Robert Todd
Home Financials for this Owner
Home Financials are based on the most recent Mortgage that was taken out on this home.
Original Mortgage
$96,533
Interest Rate
2.76%
Mortgage Type
New Conventional
Create a Home Valuation Report for This Property
The Home Valuation Report is an in-depth analysis detailing your home's value as well as a comparison with similar homes in the area
Home Values in the Area
Average Home Value in this Area
Purchase History
| Date | Buyer | Sale Price | Title Company |
|---|---|---|---|
| Hicks Justin Paul | $140,000 | -- | |
| Hicks Sonya | $102,000 | -- | |
| Thomas Robert Todd | -- | -- |
Source: Public Records
Mortgage History
| Date | Status | Borrower | Loan Amount |
|---|---|---|---|
| Previous Owner | Hicks Justin Paul | $105,000 | |
| Previous Owner | Hicks Sonya | $22,311 | |
| Previous Owner | Thomas Robert Todd | $96,533 |
Source: Public Records
Tax History Compared to Growth
Tax History
| Year | Tax Paid | Tax Assessment Tax Assessment Total Assessment is a certain percentage of the fair market value that is determined by local assessors to be the total taxable value of land and additions on the property. | Land | Improvement |
|---|---|---|---|---|
| 2025 | $3,389 | $103,160 | $16,040 | $87,120 |
| 2024 | $3,389 | $98,320 | $14,480 | $83,840 |
| 2023 | $2,751 | $96,520 | $13,960 | $82,560 |
| 2022 | $3,192 | $82,160 | $12,880 | $69,280 |
| 2021 | $2,489 | $63,840 | $11,080 | $52,760 |
| 2020 | $2,340 | $59,960 | $10,400 | $49,560 |
| 2019 | $2,203 | $56,400 | $9,880 | $46,520 |
| 2018 | $2,073 | $53,000 | $9,120 | $43,880 |
| 2016 | $1,679 | $49,800 | $7,200 | $42,600 |
| 2015 | $1,330 | $39,920 | $7,160 | $32,760 |
| 2014 | $1,234 | $37,200 | $7,160 | $30,040 |
Source: Public Records
Map
Nearby Homes
- 6079 Highway 155 N
- 5335 E Fairview Rd SW
- 231 Sorrow Rd
- 0 Flat Shoals Church Rd Unit 10642485
- 0 Flat Shoals Church Rd Unit 10642435
- 0 Flat Shoals Church Rd Unit 10642461
- 5155 E Fairview Rd SW
- 4925 Cook Rd SW
- 1110 Estates Ct
- 5339 Highway 155 N
- 0 E Mays Rd Unit 10496305
- 3710 Highway 155 SW
- 1616 Palmilla Way SW
- 157 Hambrick Dr
- 2513 Overlake Ln
- 1800 Carribean Ct SW
- 5149 Highway 155 N
- 373 Vicki Ln
- 120 Bowen Rd
- 5933 Stockbridge Highway 155
- 5933 Georgia 155 N
- 5933 Highway 155 N
- 0 Hwy 155 Rd Unit 2744397
- 0 Hwy 155 Rd Unit 7348047
- 0 Hwy 155 Rd Unit 3701118
- 0 Highway 155 Unit 5353360
- 0 Highway 155 Unit 20074442
- 0 Highway 155 Unit 8725328
- 0 Hwy 155 Rd Unit 7441127
- 0 Highway 155 Unit 7190739
- 0 Highway 155 Unit 7057020
- 0 Highway 155 Unit 8137256
- 0 Highway 155 Unit 8921593
- 0 Highway 155 Unit 8921591
- 0 Hwy 155 Rd Unit 8921593
- 0 Hwy 155 Rd Unit 8921591
- 0 Highway 155 Unit 8712509
- 0 Highway 155 Unit 8712501
- 0 Hwy 155 Rd Unit 3168646