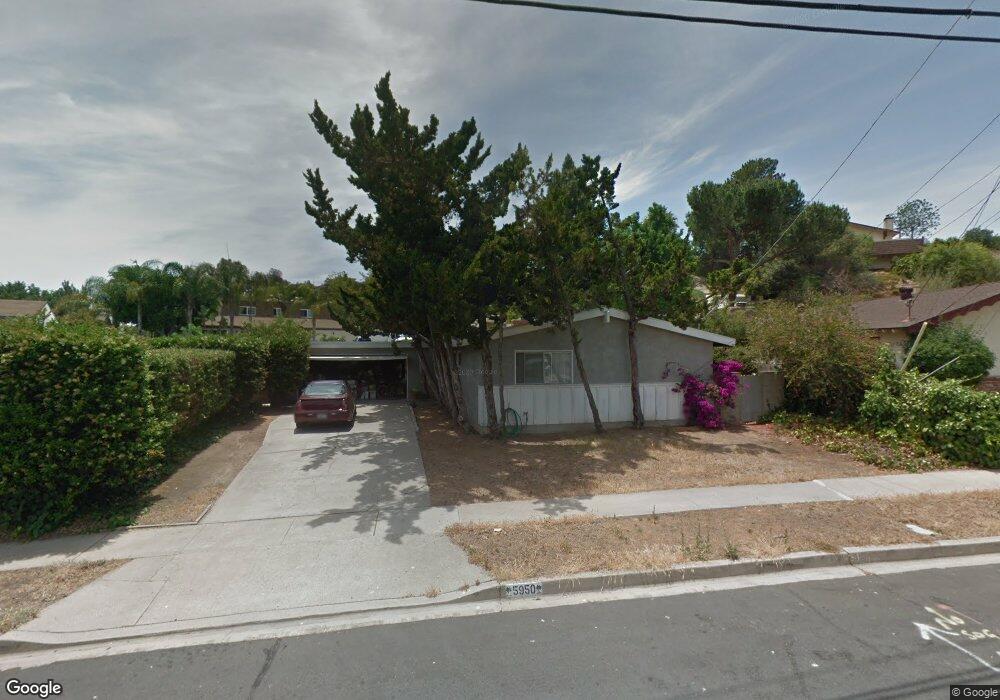
5950 Bob St La Mesa, CA 91942
Estimated Value: $875,779 - $963,000
4
Beds
2
Baths
1,352
Sq Ft
$675/Sq Ft
Est. Value
About This Home
This home is located at 5950 Bob St, La Mesa, CA 91942 and is currently estimated at $912,195, approximately $674 per square foot. 5950 Bob St is a home located in San Diego County with nearby schools including Murray Manor Elementary School, Parkway Academy, and Grossmont High School.
Ownership History
Date
Name
Owned For
Owner Type
Purchase Details
Closed on
May 8, 2018
Sold by
Traphagen Terry
Bought by
Traphagen Terry and Traphagen Tris
Current Estimated Value
Purchase Details
Closed on
Apr 28, 2017
Sold by
Traphagen Tris and Traphagen Terry
Bought by
Traphagen Terry
Home Financials for this Owner
Home Financials are based on the most recent Mortgage that was taken out on this home.
Original Mortgage
$712,500
Outstanding Balance
$625,005
Interest Rate
4.37%
Mortgage Type
Reverse Mortgage Home Equity Conversion Mortgage
Estimated Equity
$287,190
Purchase Details
Closed on
Jun 22, 2012
Sold by
Newton Glendell W
Bought by
Traphagen Tris
Purchase Details
Closed on
Feb 13, 2010
Sold by
Newton Glendell W
Bought by
Newton Glendell W
Create a Home Valuation Report for This Property
The Home Valuation Report is an in-depth analysis detailing your home's value as well as a comparison with similar homes in the area
Purchase History
| Date | Buyer | Sale Price | Title Company |
|---|---|---|---|
| Traphagen Terry | -- | None Available | |
| Traphagen Terry | -- | None Available | |
| Traphagen Tris | -- | Tsi | |
| Traphagen Tris | -- | None Available | |
| Newton Glendell W | -- | None Available |
Source: Public Records
Mortgage History
| Date | Status | Borrower | Loan Amount |
|---|---|---|---|
| Open | Traphagen Tris | $712,500 |
Source: Public Records
Tax History
| Year | Tax Paid | Tax Assessment Tax Assessment Total Assessment is a certain percentage of the fair market value that is determined by local assessors to be the total taxable value of land and additions on the property. | Land | Improvement |
|---|---|---|---|---|
| 2025 | $1,414 | $79,647 | $17,062 | $62,585 |
| 2024 | $1,414 | $78,086 | $16,728 | $61,358 |
| 2023 | $1,376 | $76,555 | $16,400 | $60,155 |
| 2022 | $1,388 | $75,055 | $16,079 | $58,976 |
| 2021 | $1,383 | $73,584 | $15,764 | $57,820 |
| 2020 | $1,393 | $72,831 | $15,603 | $57,228 |
| 2019 | $1,322 | $71,404 | $15,298 | $56,106 |
| 2018 | $1,284 | $70,005 | $14,999 | $55,006 |
| 2017 | $1,240 | $68,633 | $14,705 | $53,928 |
| 2016 | $1,207 | $67,288 | $14,417 | $52,871 |
| 2015 | $1,206 | $66,278 | $14,201 | $52,077 |
| 2014 | $1,152 | $64,980 | $13,923 | $51,057 |
Source: Public Records
Map
Nearby Homes
- 5800 Lake Murray Blvd Unit 49
- 5800 Lake Murray Blvd Unit 83
- 5875 Lake Murray Blvd
- 8100 Place
- 8045 Laird St
- 5914 Dugan Ave
- 6060 Cowles Mountain Blvd
- 5661 Lake Park Way Unit 4
- 5649 Lake Park Way Unit 101
- 5715 Baltimore Dr Unit 20
- 5715 Baltimore Dr Unit 86
- 5715 Baltimore Dr Unit 39
- 5715 Baltimore Dr Unit 91
- 5707 Baltimore Dr Unit 12
- 7593 El Paso St
- 6263 Cowles Mountain Blvd
- 5700 Baltimore Dr Unit 202
- 5700 Baltimore Dr Unit 154
- 5700 Baltimore Dr Unit 223
- 5700 Baltimore Dr Unit 187
Your Personal Tour Guide
Ask me questions while you tour the home.