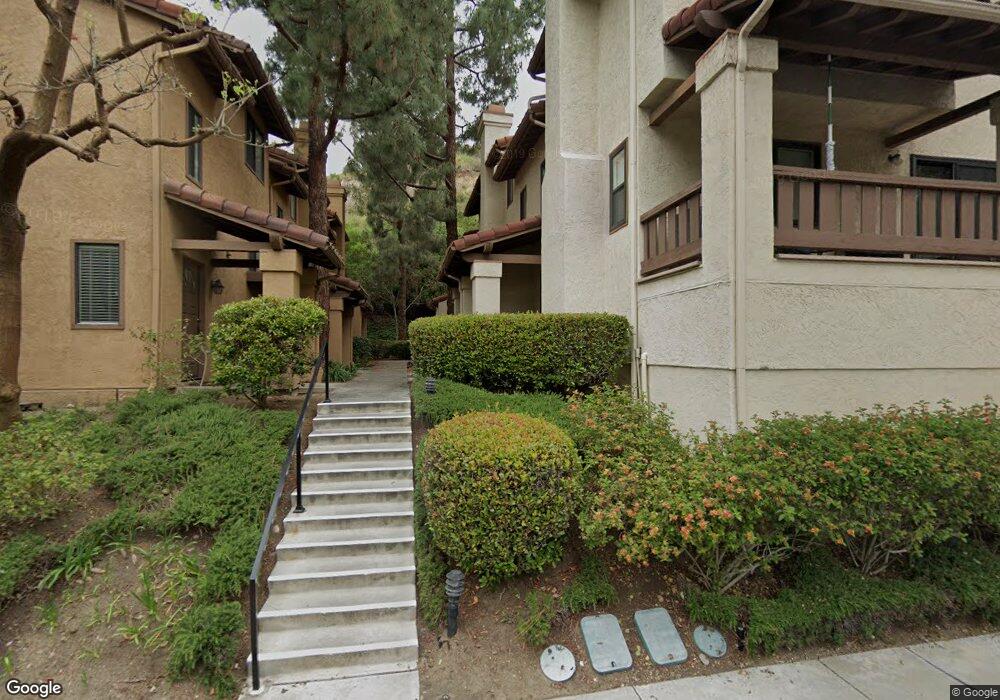
5950 Mission Center Rd Unit C San Diego, CA 92123
Birdland NeighborhoodEstimated Value: $721,000 - $801,395
2
Beds
3
Baths
1,480
Sq Ft
$514/Sq Ft
Est. Value
About This Home
This home is located at 5950 Mission Center Rd Unit C, San Diego, CA 92123 and is currently estimated at $761,349, approximately $514 per square foot. 5950 Mission Center Rd Unit C is a home located in San Diego County with nearby schools including Nipaquay Elementary, Fletcher Elementary School, and Montgomery Middle School.
Ownership History
Date
Name
Owned For
Owner Type
Purchase Details
Closed on
Dec 5, 2019
Sold by
Cogan William Helmut and Cogan Julia Ann
Bought by
Crisp Letia C
Current Estimated Value
Home Financials for this Owner
Home Financials are based on the most recent Mortgage that was taken out on this home.
Original Mortgage
$491,625
Outstanding Balance
$433,438
Interest Rate
3.6%
Mortgage Type
New Conventional
Estimated Equity
$327,911
Purchase Details
Closed on
Mar 21, 1994
Sold by
Cogan William Helmut and Cogan Julia Ann
Bought by
Cogan William Helmut and Cogan Julia Ann
Home Financials for this Owner
Home Financials are based on the most recent Mortgage that was taken out on this home.
Original Mortgage
$119,900
Interest Rate
7.15%
Mortgage Type
VA
Purchase Details
Closed on
Sep 18, 1986
Create a Home Valuation Report for This Property
The Home Valuation Report is an in-depth analysis detailing your home's value as well as a comparison with similar homes in the area
Home Values in the Area
Average Home Value in this Area
Purchase History
| Date | Buyer | Sale Price | Title Company |
|---|---|---|---|
| Crisp Letia C | $517,500 | First American Title | |
| Cogan William Helmut | -- | First American Title Co | |
| -- | $133,000 | -- |
Source: Public Records
Mortgage History
| Date | Status | Borrower | Loan Amount |
|---|---|---|---|
| Open | Crisp Letia C | $491,625 | |
| Previous Owner | Cogan William Helmut | $119,900 |
Source: Public Records
Tax History Compared to Growth
Tax History
| Year | Tax Paid | Tax Assessment Tax Assessment Total Assessment is a certain percentage of the fair market value that is determined by local assessors to be the total taxable value of land and additions on the property. | Land | Improvement |
|---|---|---|---|---|
| 2025 | $6,760 | $565,956 | $147,512 | $418,444 |
| 2024 | $6,760 | $554,860 | $144,620 | $410,240 |
| 2023 | $6,609 | $543,982 | $141,785 | $402,197 |
| 2022 | $6,432 | $533,316 | $139,005 | $394,311 |
| 2021 | $6,387 | $522,860 | $136,280 | $386,580 |
| 2020 | $2,950 | $237,412 | $61,880 | $175,532 |
| 2019 | $2,898 | $232,758 | $60,667 | $172,091 |
| 2018 | $2,710 | $228,195 | $59,478 | $168,717 |
| 2017 | $2,646 | $223,721 | $58,312 | $165,409 |
| 2016 | $2,604 | $219,335 | $57,169 | $162,166 |
| 2015 | $2,566 | $216,042 | $56,311 | $159,731 |
| 2014 | $2,526 | $211,811 | $55,208 | $156,603 |
Source: Public Records
Map
Nearby Homes
- 5806 Mission Center Rd Unit C
- 2045 Cardinal Dr
- 2130 Cardinal Dr
- 2432 Aperture Cir
- 2472 Aperture Cir
- 7786 Stylus Dr
- 2335 Aperture Cir
- 8355 Summit Way
- 7774 Stylus Dr
- 2321 Cardinal Dr
- 7830 Inception Way
- 8353 Distinctive Dr
- 8363 Distinctive Dr
- 7887 Stylus Dr
- 7859 Stylus Dr
- 2470 Via Alta
- 7853 Inception Way
- 2567 Pheasant Dr
- 7625 Teebird Ln
- 8441 Encino Ave
- 5930 Mission Center Rd Unit B
- 5910 Mission Center Rd Unit A
- 5910 Mission Center Rd Unit B
- 5930 Mission Center Rd Unit A
- 5930 Mission Center Rd Unit C
- 5940 Mission Center Rd Unit B
- 5940 Mission Center Rd Unit A
- 5960 Mission Center Rd
- 5960 Mission Center Rd Unit C
- 5960 Mission Center Rd Unit B
- 5960 Mission Center Rd Unit A
- 0 Mission Center Rd Unit 130041855
- 0 Mission Center Rd Unit 130046086
- 5950 Mission Center Rd Unit A
- 5950 Mission Center Rd Unit B
- 5970 Mission Center Rd Unit A
- 5970 Mission Center Rd Unit B
- 5920 Mission Center Rd
- 5920 Mission Center Rd Unit B
- 5920 Mission Center Rd Unit A