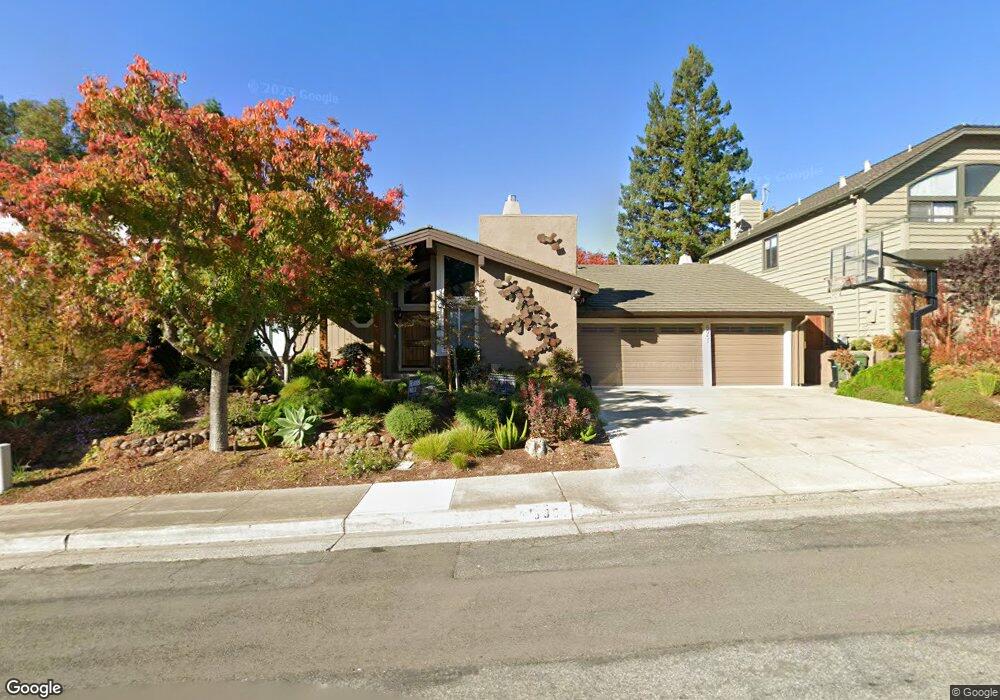
5951 Vista Loop San Jose, CA 95124
East Los Gatos NeighborhoodEstimated Value: $2,520,000 - $3,186,000
3
Beds
3
Baths
2,329
Sq Ft
$1,216/Sq Ft
Est. Value
About This Home
This home is located at 5951 Vista Loop, San Jose, CA 95124 and is currently estimated at $2,832,934, approximately $1,216 per square foot. 5951 Vista Loop is a home located in Santa Clara County with nearby schools including Guadalupe Elementary School, Dartmouth Middle School, and Leigh High School.
Ownership History
Date
Name
Owned For
Owner Type
Purchase Details
Closed on
Jul 28, 2011
Sold by
Bloomquist Douglas L
Bought by
Bloomquist Douglas L
Current Estimated Value
Purchase Details
Closed on
Apr 9, 2001
Sold by
Bloomquist Douglas L and Bloomquist Laura
Bought by
Bloomquist Douglas L and Bloomquist Laura
Purchase Details
Closed on
Oct 17, 2000
Sold by
Peter Bohl and Martin Bohl Joan Trustee
Bought by
Bloomquist Douglas and Bloomquist Laura
Home Financials for this Owner
Home Financials are based on the most recent Mortgage that was taken out on this home.
Original Mortgage
$460,000
Outstanding Balance
$165,990
Interest Rate
7.96%
Estimated Equity
$2,666,944
Purchase Details
Closed on
Feb 19, 1997
Sold by
Peter Bohl
Bought by
Bohl Joan Martin and Bohl Peter
Create a Home Valuation Report for This Property
The Home Valuation Report is an in-depth analysis detailing your home's value as well as a comparison with similar homes in the area
Home Values in the Area
Average Home Value in this Area
Purchase History
| Date | Buyer | Sale Price | Title Company |
|---|---|---|---|
| Bloomquist Douglas L | -- | None Available | |
| Bloomquist Douglas L | -- | Financial Title Company | |
| Bloomquist Douglas | $810,000 | Chicago Title Co | |
| Bohl Joan Martin | -- | -- |
Source: Public Records
Mortgage History
| Date | Status | Borrower | Loan Amount |
|---|---|---|---|
| Open | Bloomquist Douglas | $460,000 |
Source: Public Records
Tax History
| Year | Tax Paid | Tax Assessment Tax Assessment Total Assessment is a certain percentage of the fair market value that is determined by local assessors to be the total taxable value of land and additions on the property. | Land | Improvement |
|---|---|---|---|---|
| 2025 | $16,662 | $1,220,527 | $671,291 | $549,236 |
| 2024 | $16,662 | $1,196,596 | $658,129 | $538,467 |
| 2023 | $16,326 | $1,173,134 | $645,225 | $527,909 |
| 2022 | $15,978 | $1,150,132 | $632,574 | $517,558 |
| 2021 | $15,675 | $1,127,581 | $620,171 | $507,410 |
| 2020 | $15,362 | $1,116,020 | $613,812 | $502,208 |
| 2019 | $15,099 | $1,094,138 | $601,777 | $492,361 |
| 2018 | $14,726 | $1,072,685 | $589,978 | $482,707 |
| 2017 | $14,527 | $1,051,653 | $578,410 | $473,243 |
| 2016 | $13,843 | $1,031,033 | $567,069 | $463,964 |
| 2015 | $13,625 | $1,015,547 | $558,552 | $456,995 |
| 2014 | $12,942 | $995,655 | $547,611 | $448,044 |
Source: Public Records
Map
Nearby Homes
- 1685 Zinnia Ln
- 530 Santa Rosa Dr
- 114 Gemini Ct
- 1574 Guadalajara Dr
- 1714 Via Cortina
- 1516 Ivan Place
- 1666 Blossom Hill Rd
- 1855 Sycamore Creek
- 1705 Blossom Hill Rd
- 311 Santa Rosa Dr
- 267 Belvue Dr
- 5451 Lauren Dr
- 1769 Gilda Way
- 151 Old Orchard Dr
- 1459 Nesbit Ct
- 1544 Bouchard Dr
- 0000 Harwood Rd
- 0000 Wagner Rd
- 15480 Willow Dr
- 5805 Chambertin Dr
- 5955 Vista Loop
- 5947 Vista Loop
- 5943 Vista Loop
- 115 Alerche Dr
- 5961 Vista Loop
- 5950 Vista Loop
- 5956 Vista Loop
- 5942 Vista Loop
- 5939 Vista Loop
- 5964 Vista Loop
- 5965 Vista Loop
- 5958 Vista Loop
- 1670 Glenrock Ct
- 5937 Vista Loop
- 1664 Glenrock Ct
- 5935 Vista Loop
- 1668 Glenrock Ct
- 5971 Vista Loop
- 117 Alerche Dr
- 5974 Vista Loop
Your Personal Tour Guide
Ask me questions while you tour the home.