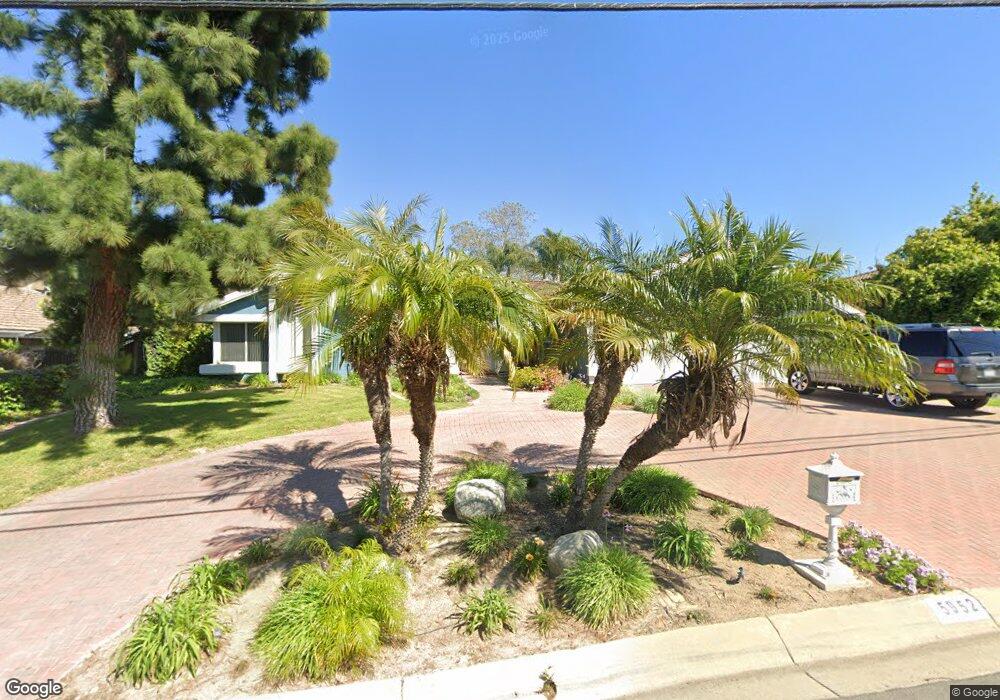
5952 Highland Ave Yorba Linda, CA 92886
Estimated Value: $1,693,995 - $2,218,000
3
Beds
3
Baths
2,808
Sq Ft
$676/Sq Ft
Est. Value
About This Home
This home is located at 5952 Highland Ave, Yorba Linda, CA 92886 and is currently estimated at $1,899,249, approximately $676 per square foot. 5952 Highland Ave is a home located in Orange County with nearby schools including Linda Vista Elementary School, Yorba Linda Middle School, and Friends Christian School.
Ownership History
Date
Name
Owned For
Owner Type
Purchase Details
Closed on
Aug 25, 2016
Sold by
Conaty Marilyn
Bought by
Conaty Marilyn and Marilyn E Conaty Living Trust
Current Estimated Value
Purchase Details
Closed on
Aug 20, 2012
Sold by
Conaty Marilyn
Bought by
Conaty Marilyn and Marilyn Conaty Trust
Purchase Details
Closed on
Nov 1, 1994
Sold by
Kenny John T and Kenny Virginia M
Bought by
Glaser Betty Jane and Betty Jane Glaser Trust
Purchase Details
Closed on
Jan 31, 1994
Sold by
Kenny John T and Kenny Virginia M
Bought by
Kenny John T and Kenny Virginia M
Purchase Details
Closed on
Nov 11, 1993
Sold by
Kenny John T and Kenny Virginia M
Bought by
Kenny John T and Kenny Virginia M
Home Financials for this Owner
Home Financials are based on the most recent Mortgage that was taken out on this home.
Original Mortgage
$273,000
Interest Rate
6.85%
Purchase Details
Closed on
Jul 1, 1993
Sold by
Kenny John T and Kenny Virginia M
Bought by
Kenny John T and Kenny Virginia M
Create a Home Valuation Report for This Property
The Home Valuation Report is an in-depth analysis detailing your home's value as well as a comparison with similar homes in the area
Home Values in the Area
Average Home Value in this Area
Purchase History
| Date | Buyer | Sale Price | Title Company |
|---|---|---|---|
| Conaty Marilyn | -- | None Available | |
| Conaty Marilyn | -- | None Available | |
| Glaser Betty Jane | $445,000 | Gateway Title | |
| Kenny John T | -- | -- | |
| Kenny John T | -- | United Title Company | |
| Kenny John T | -- | -- |
Source: Public Records
Mortgage History
| Date | Status | Borrower | Loan Amount |
|---|---|---|---|
| Previous Owner | Kenny John T | $273,000 |
Source: Public Records
Tax History Compared to Growth
Tax History
| Year | Tax Paid | Tax Assessment Tax Assessment Total Assessment is a certain percentage of the fair market value that is determined by local assessors to be the total taxable value of land and additions on the property. | Land | Improvement |
|---|---|---|---|---|
| 2025 | $8,379 | $752,799 | $457,239 | $295,560 |
| 2024 | $8,379 | $738,039 | $448,274 | $289,765 |
| 2023 | $8,230 | $723,568 | $439,484 | $284,084 |
| 2022 | $8,151 | $709,381 | $430,867 | $278,514 |
| 2021 | $8,005 | $695,472 | $422,419 | $273,053 |
| 2020 | $7,907 | $688,341 | $418,087 | $270,254 |
| 2019 | $7,631 | $674,845 | $409,890 | $264,955 |
| 2018 | $7,535 | $661,613 | $401,853 | $259,760 |
| 2017 | $7,412 | $648,641 | $393,974 | $254,667 |
| 2016 | $7,262 | $635,923 | $386,249 | $249,674 |
| 2015 | $7,173 | $626,371 | $380,447 | $245,924 |
| 2014 | $6,960 | $614,102 | $372,995 | $241,107 |
Source: Public Records
Map
Nearby Homes
- 6032 Sun Knoll Cir
- 17967 Sun Hill Dr
- 6052 Candle Light Ln
- 2024 Tanforan Ave
- 17842 Caballo Dr
- 5661 Casa Loma Ave
- 2017 Orchard Dr Unit 11
- 17841 Buena Vista Ave
- 1833 Taft Ln
- 4568 E Meadowhill Ave
- 1958 Avenida Del Sol
- 1963 Via de la Luna
- 1952 Avenida Del Sol
- 1712 N Glenview Ave
- 18571 Buena Vista Ave
- 5231 Highland Ave
- 1891 N Garland Ln
- 1817 N Symphony St
- 18501 Woodwind Ln
- 5141 Siesta Ln
- 5932 Highland Ave
- 5922 Highland Ave
- 18041 Lantana Dr
- 18107 Lantana Dr
- 17997 Sun Knoll Dr
- 18042 Peppergrove St
- 6000 Highland Ave
- 17991 Sun Knoll Dr
- 18022 Peppergrove St
- 18112 Lantana Dr
- 18062 Peppergrove St
- 18122 Lantana Dr
- 5855 Highland Ave
- 18102 Lantana Dr
- 18092 Lantana Dr
- 18062 Lantana Dr
- 6002 Highland Ave
- 18082 Peppergrove St
- 18082 Lantana Dr
- 17982 Sun Knoll Dr