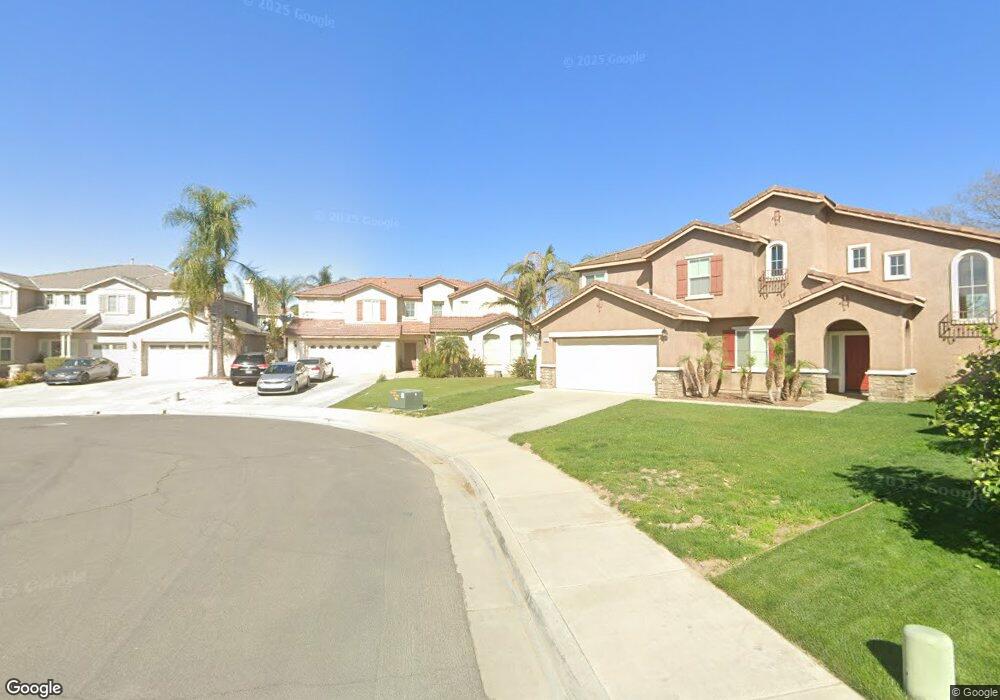
5954 Golden Nectar Ct Corona, CA 92880
Estimated Value: $973,000 - $1,015,000
4
Beds
3
Baths
2,985
Sq Ft
$332/Sq Ft
Est. Value
About This Home
This home is located at 5954 Golden Nectar Ct, Corona, CA 92880 and is currently estimated at $992,468, approximately $332 per square foot. 5954 Golden Nectar Ct is a home located in Riverside County with nearby schools including Rosa Parks Elementary School, Dr. Augustine Ramirez Intermediate School, and Eleanor Roosevelt High School.
Ownership History
Date
Name
Owned For
Owner Type
Purchase Details
Closed on
Aug 20, 2008
Sold by
Wells Fargo Bank Na
Bought by
Castro Aaron P and Castro Jennifer U
Current Estimated Value
Home Financials for this Owner
Home Financials are based on the most recent Mortgage that was taken out on this home.
Original Mortgage
$417,403
Outstanding Balance
$276,096
Interest Rate
6.49%
Mortgage Type
FHA
Estimated Equity
$716,372
Purchase Details
Closed on
Nov 28, 2007
Sold by
Belz Larry and Belz Ann M
Bought by
Wells Fargo Bank Na
Purchase Details
Closed on
Jul 31, 2003
Sold by
Western Pacific Housing Inc
Bought by
Belz Larry and Belz Ann M
Home Financials for this Owner
Home Financials are based on the most recent Mortgage that was taken out on this home.
Original Mortgage
$250,336
Interest Rate
5.17%
Mortgage Type
Purchase Money Mortgage
Create a Home Valuation Report for This Property
The Home Valuation Report is an in-depth analysis detailing your home's value as well as a comparison with similar homes in the area
Home Values in the Area
Average Home Value in this Area
Purchase History
| Date | Buyer | Sale Price | Title Company |
|---|---|---|---|
| Castro Aaron P | $425,000 | First American Title Ins Co | |
| Wells Fargo Bank Na | $330,000 | Accommodation | |
| Belz Larry | $334,000 | First American Title Co |
Source: Public Records
Mortgage History
| Date | Status | Borrower | Loan Amount |
|---|---|---|---|
| Open | Castro Aaron P | $417,403 | |
| Previous Owner | Belz Larry | $250,336 |
Source: Public Records
Tax History Compared to Growth
Tax History
| Year | Tax Paid | Tax Assessment Tax Assessment Total Assessment is a certain percentage of the fair market value that is determined by local assessors to be the total taxable value of land and additions on the property. | Land | Improvement |
|---|---|---|---|---|
| 2025 | $8,272 | $569,744 | $160,959 | $408,785 |
| 2023 | $8,272 | $547,621 | $154,709 | $392,912 |
| 2022 | $8,103 | $536,884 | $151,676 | $385,208 |
| 2021 | $7,971 | $526,357 | $148,702 | $377,655 |
| 2020 | $7,872 | $520,961 | $147,178 | $373,783 |
| 2019 | $8,050 | $510,747 | $144,293 | $366,454 |
| 2018 | $7,887 | $500,733 | $141,465 | $359,268 |
| 2017 | $7,755 | $490,916 | $138,692 | $352,224 |
| 2016 | $7,663 | $481,291 | $135,973 | $345,318 |
| 2015 | $7,533 | $474,064 | $133,932 | $340,132 |
| 2014 | $7,434 | $464,779 | $131,309 | $333,470 |
Source: Public Records
Map
Nearby Homes
- 3317 Cantona Paseo
- 13487 Rainier Ave
- 5840 Redhaven St
- 4928 S Prince Way
- 6174 Risingstar Dr
- 4852 S Jordan Ave
- 5780 Redhaven St
- 3170 E Painted Crescent St
- 3137 E Discovery St
- 3144 E Chip Smith Way
- 3137 E Chip Smith Way
- 3126 E Painted Crescent St
- 3249 E Butterfly Ln
- 4855 S Pastel Ln
- 5857 Oatfield Ave
- 5873 Oatfield Ave
- 5869 Oatfield Ave
- 3234 E Lavender Dr
- 3177 Masterpiece St
- 5073 S Heritage Paseo
- 5947 Golden Nectar Ct
- 5964 Golden Nectar Ct
- 8706 Festival Way
- 8712 Festival Way
- 8743 Festival Way
- 5957 Golden Nectar Ct
- 5896 Maycrest Ave
- 5974 Golden Nectar Ct
- 5916 Maycrest Ave
- 5967 Golden Nectar Ct
- 5926 Maycrest Ave
- 5984 Golden Nectar Ct
- 5946 Maycrest Ave
- 5977 Golden Nectar Ct
- 5956 Maycrest Ave
- 5987 Golden Nectar Ct
- 5994 Golden Nectar Ct
- 5976 Maycrest Ave
- 5899 Maycrest Ave
- 5909 Maycrest Ave