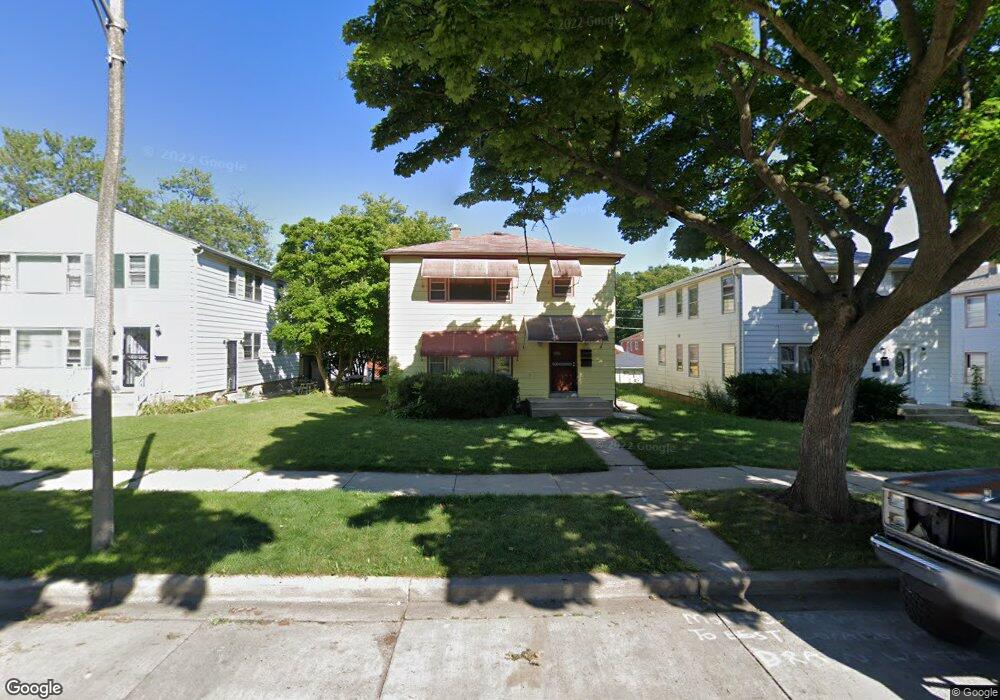
5956 N 37th St Unit 5958 Milwaukee, WI 53209
Thurston Woods NeighborhoodEstimated Value: $152,000 - $226,293
4
Beds
2
Baths
1,872
Sq Ft
$96/Sq Ft
Est. Value
About This Home
This home is located at 5956 N 37th St Unit 5958, Milwaukee, WI 53209 and is currently estimated at $178,823, approximately $95 per square foot. 5956 N 37th St Unit 5958 is a home located in Milwaukee County with nearby schools including Craig Montessori School, Milwaukee German Immersion School, and La Escuela Fratney.
Ownership History
Date
Name
Owned For
Owner Type
Purchase Details
Closed on
Dec 27, 2010
Sold by
Fuller Mary
Bought by
Mef Plus 4 Llc
Current Estimated Value
Purchase Details
Closed on
Dec 1, 2010
Sold by
The Bank Of New York Mellon
Bought by
Fuller Mary
Purchase Details
Closed on
Jun 29, 2010
Sold by
Glenn Wayne A and Glenn Denea M
Bought by
The Bank Of New York Mellon and The Bank Of New York
Purchase Details
Closed on
Jul 21, 2005
Sold by
Brantley Christopher T
Bought by
Glenn Wayne A and Glenn Deanea M
Home Financials for this Owner
Home Financials are based on the most recent Mortgage that was taken out on this home.
Original Mortgage
$95,900
Interest Rate
7.37%
Mortgage Type
Fannie Mae Freddie Mac
Purchase Details
Closed on
May 22, 2001
Sold by
Brantley Jonathan D
Bought by
Brantley Christopher T
Home Financials for this Owner
Home Financials are based on the most recent Mortgage that was taken out on this home.
Original Mortgage
$57,600
Interest Rate
7.14%
Mortgage Type
Purchase Money Mortgage
Create a Home Valuation Report for This Property
The Home Valuation Report is an in-depth analysis detailing your home's value as well as a comparison with similar homes in the area
Home Values in the Area
Average Home Value in this Area
Purchase History
| Date | Buyer | Sale Price | Title Company |
|---|---|---|---|
| Mef Plus 4 Llc | -- | None Available | |
| Fuller Mary | $29,100 | None Available | |
| The Bank Of New York Mellon | $33,000 | None Available | |
| Glenn Wayne A | $119,900 | -- | |
| Brantley Christopher T | $60,000 | -- |
Source: Public Records
Mortgage History
| Date | Status | Borrower | Loan Amount |
|---|---|---|---|
| Previous Owner | Glenn Wayne A | $95,900 | |
| Previous Owner | Brantley Christopher T | $57,600 |
Source: Public Records
Tax History Compared to Growth
Tax History
| Year | Tax Paid | Tax Assessment Tax Assessment Total Assessment is a certain percentage of the fair market value that is determined by local assessors to be the total taxable value of land and additions on the property. | Land | Improvement |
|---|---|---|---|---|
| 2024 | $4,498 | $128,200 | $4,000 | $124,200 |
| 2023 | $2,235 | $94,600 | $4,000 | $90,600 |
| 2022 | $4,027 | $94,600 | $4,000 | $90,600 |
| 2021 | $3,042 | $83,500 | $3,900 | $79,600 |
| 2020 | $3,746 | $83,500 | $3,900 | $79,600 |
| 2019 | $2,366 | $65,100 | $4,000 | $61,100 |
| 2018 | $2,318 | $65,100 | $4,000 | $61,100 |
| 2017 | $1,649 | $63,100 | $6,300 | $56,800 |
| 2016 | $2,301 | $62,200 | $6,300 | $55,900 |
| 2015 | -- | $67,200 | $6,300 | $60,900 |
| 2014 | -- | $70,800 | $6,300 | $64,500 |
| 2013 | -- | $83,300 | $6,300 | $77,000 |
Source: Public Records
Map
Nearby Homes
- 5912 N 36th St Unit 5914
- 5862 N 37th St
- 5767 N 39th St
- 5751 N 38th St
- 5738 N 38th St
- 3730 W Kaul Ave
- 5729 N 37th St
- 5673 N 35th St
- 5791 N Teutonia Ave
- 6153 N 39th St
- 5717 N 37th St
- 3819 W Douglas Ave
- 5629 N Teutonia Ave
- 4228 W Newton Place
- 5693 N 42nd St
- 5953 N 41st St
- 5561 N 40th St
- 5471 N 36th St
- 5528 N 32nd St
- 5460 N 37th St
- 5950 N 37th St Unit 5952
- 5962 N 37th St Unit 5964
- 5944 N 37th St Unit 5946
- 5968 N 37th St Unit 5970
- 5938 N 37th St Unit 5940
- 5974 N 37th St Unit 5976
- 5957 N 36th St Unit 5959
- 5963 N 36th St Unit 5965
- 5945 N 36th St Unit 5947
- 5969 N 36th St Unit 5971
- 5932 N 37th St Unit 5934
- 3701 W Florist Ave Unit 3703
- 5939 N 36th St Unit 5941
- 5959 N 37th St
- 5975 N 36th St Unit 5977
- 5951 N 37th St Unit 5953
- 5947 N 37th St
- 5926 N 37th St Unit 5928
- 5933 N 36th St Unit 5935
- 5943 N 37th St