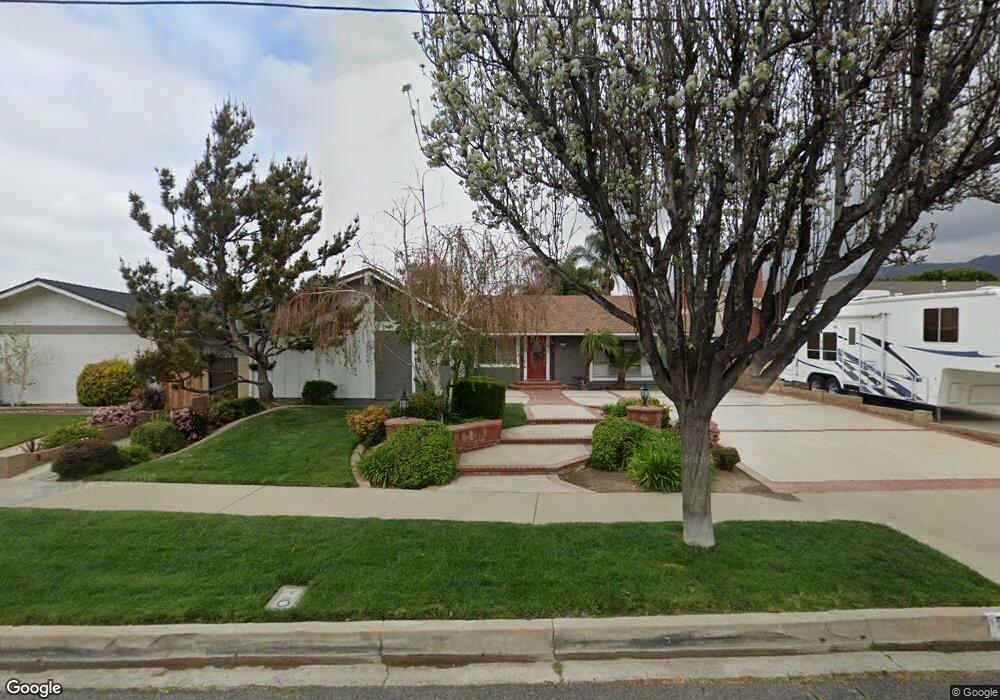
5959 Cochran St Simi Valley, CA 93063
East Simi Valley NeighborhoodEstimated Value: $825,155 - $1,044,000
4
Beds
2
Baths
1,826
Sq Ft
$499/Sq Ft
Est. Value
About This Home
This home is located at 5959 Cochran St, Simi Valley, CA 93063 and is currently estimated at $910,289, approximately $498 per square foot. 5959 Cochran St is a home located in Ventura County with nearby schools including White Oak Elementary School, Valley View Middle School, and Simi Valley High School.
Ownership History
Date
Name
Owned For
Owner Type
Purchase Details
Closed on
Apr 28, 2011
Sold by
Roussin Rick R
Bought by
Byoll Llc
Current Estimated Value
Purchase Details
Closed on
Mar 14, 2011
Sold by
The Bank Of New York Mellon
Bought by
Roussin Rick R
Purchase Details
Closed on
Dec 8, 2009
Sold by
Fuentes Henry D and Fuentes Belinda R
Bought by
The Bank Of New York Mellon
Purchase Details
Closed on
Sep 27, 2005
Sold by
Burns Steven R and Burns Barbara E
Bought by
Fuentes Henry D and Fuentes Belinda R
Home Financials for this Owner
Home Financials are based on the most recent Mortgage that was taken out on this home.
Original Mortgage
$151,250
Interest Rate
5.68%
Mortgage Type
Stand Alone Second
Create a Home Valuation Report for This Property
The Home Valuation Report is an in-depth analysis detailing your home's value as well as a comparison with similar homes in the area
Home Values in the Area
Average Home Value in this Area
Purchase History
| Date | Buyer | Sale Price | Title Company |
|---|---|---|---|
| Byoll Llc | -- | None Available | |
| Roussin Rick R | $370,000 | Lawyers Title Company | |
| The Bank Of New York Mellon | $410,000 | Accommodation | |
| Fuentes Henry D | $605,000 | Fidelity National Title Co |
Source: Public Records
Mortgage History
| Date | Status | Borrower | Loan Amount |
|---|---|---|---|
| Previous Owner | Fuentes Henry D | $151,250 | |
| Previous Owner | Fuentes Henry D | $453,750 |
Source: Public Records
Tax History Compared to Growth
Tax History
| Year | Tax Paid | Tax Assessment Tax Assessment Total Assessment is a certain percentage of the fair market value that is determined by local assessors to be the total taxable value of land and additions on the property. | Land | Improvement |
|---|---|---|---|---|
| 2025 | $5,900 | $474,023 | $237,012 | $237,011 |
| 2024 | $5,900 | $464,729 | $232,365 | $232,364 |
| 2023 | $5,548 | $455,617 | $227,809 | $227,808 |
| 2022 | $5,525 | $446,684 | $223,342 | $223,342 |
| 2021 | $5,484 | $437,926 | $218,963 | $218,963 |
| 2020 | $5,369 | $433,438 | $216,719 | $216,719 |
| 2019 | $5,126 | $424,940 | $212,470 | $212,470 |
| 2018 | $5,082 | $416,608 | $208,304 | $208,304 |
| 2017 | $4,969 | $408,440 | $204,220 | $204,220 |
| 2016 | $4,747 | $400,432 | $200,216 | $200,216 |
| 2015 | $4,647 | $394,418 | $197,209 | $197,209 |
| 2014 | $4,582 | $386,694 | $193,347 | $193,347 |
Source: Public Records
Map
Nearby Homes
- 2367 Saint Clair Ave
- 2331 Welcome Ct
- 6004 Rothko Ln
- 5813 Cochran St
- 6125 Grapevine Ct
- 2635 Sunshine Valley Ct
- 2152 Rockdale Ave
- 2238 Connell Ave
- 2026 Calle la Sombra Unit 2
- 2450 Stow St
- 2448 Stow St
- 2014 Avenida Placida Unit 4
- 2040 Freesia Ave
- 5621 Daisy St
- 2037 Freesia Ave
- 1948 Rory Ln Unit 5
- 1920 Rory Ln Unit 2
- 2059 Tulip Ave
- 1806 Rory Ln Unit 9
- 5657 Pansy St
- 5965 Cochran St
- 5947 Cochran St
- 5960 Amondo Cir
- 5948 Amondo Cir
- 5935 Cochran St
- 5977 Cochran St
- 5966 Amondo Cir
- 5936 Amondo Cir
- 5946 Cochran St
- 5934 Cochran St
- 5929 Cochran St
- 5989 Cochran St
- 2396 Fasley Ave
- 5930 Amondo Cir
- 5978 Amondo Cir
- 5926 Cochran St
- 2417 Saint Clair Ave
- 5917 Cochran St
- 5995 Cochran St
- 5949 Amondo Cir