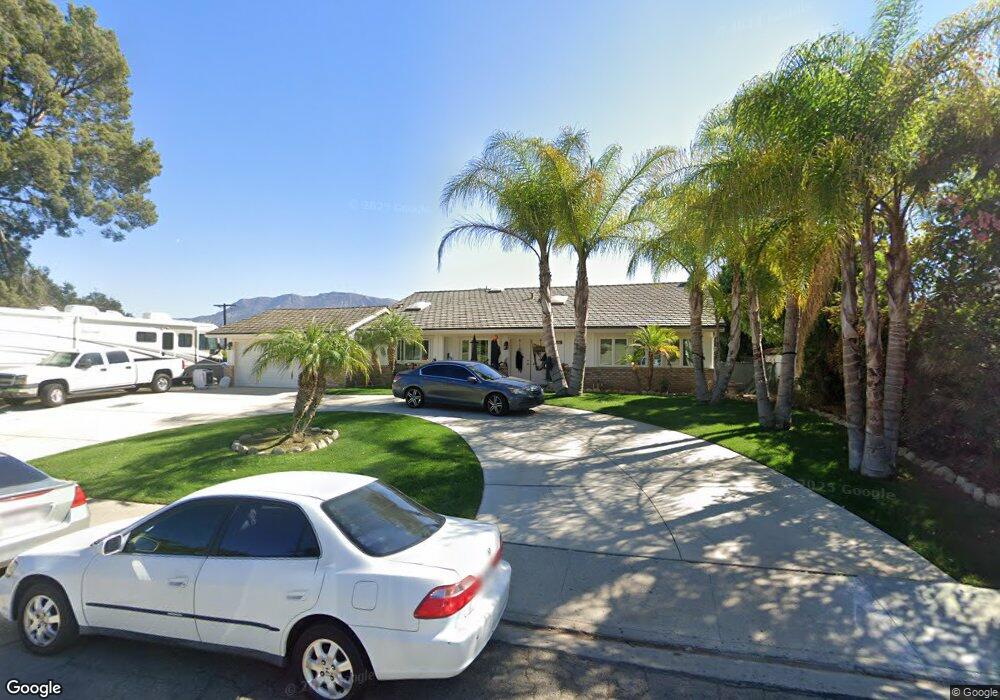
596 E View Dr Santa Paula, CA 93060
Estimated Value: $770,000 - $1,052,000
4
Beds
3
Baths
2,118
Sq Ft
$434/Sq Ft
Est. Value
About This Home
This home is located at 596 E View Dr, Santa Paula, CA 93060 and is currently estimated at $918,203, approximately $433 per square foot. 596 E View Dr is a home located in Ventura County with nearby schools including McKevett Elementary School, Isbell Middle School, and Santa Paula High.
Ownership History
Date
Name
Owned For
Owner Type
Purchase Details
Closed on
Apr 17, 2009
Sold by
Katsura Yoshiro and Katsura Betty
Bought by
Manzano Anna L and Padilla Juan R
Current Estimated Value
Home Financials for this Owner
Home Financials are based on the most recent Mortgage that was taken out on this home.
Original Mortgage
$404,006
Interest Rate
4.79%
Mortgage Type
FHA
Purchase Details
Closed on
Feb 23, 2005
Sold by
Katsura Yoshiro
Bought by
Katsura Yoshiro and Katsura Betty Dean
Purchase Details
Closed on
Dec 4, 1998
Sold by
Yoshiro Katsura
Bought by
Katsura Yoshiro
Home Financials for this Owner
Home Financials are based on the most recent Mortgage that was taken out on this home.
Original Mortgage
$150,000
Interest Rate
6.84%
Purchase Details
Closed on
Nov 19, 1998
Sold by
Yoshiro Katsura
Bought by
Katsura Yoshiro and Katsura Florence Kiyomi
Home Financials for this Owner
Home Financials are based on the most recent Mortgage that was taken out on this home.
Original Mortgage
$150,000
Interest Rate
6.84%
Create a Home Valuation Report for This Property
The Home Valuation Report is an in-depth analysis detailing your home's value as well as a comparison with similar homes in the area
Home Values in the Area
Average Home Value in this Area
Purchase History
| Date | Buyer | Sale Price | Title Company |
|---|---|---|---|
| Manzano Anna L | $450,000 | Chicago Title Company | |
| Katsura Yoshiro | -- | -- | |
| Katsura Yoshiro | -- | -- | |
| Katsura Yoshiro | -- | American Title Co |
Source: Public Records
Mortgage History
| Date | Status | Borrower | Loan Amount |
|---|---|---|---|
| Previous Owner | Manzano Anna L | $404,006 | |
| Previous Owner | Katsura Yoshiro | $150,000 |
Source: Public Records
Tax History
| Year | Tax Paid | Tax Assessment Tax Assessment Total Assessment is a certain percentage of the fair market value that is determined by local assessors to be the total taxable value of land and additions on the property. | Land | Improvement |
|---|---|---|---|---|
| 2025 | $6,644 | $580,856 | $322,701 | $258,155 |
| 2024 | $6,644 | $569,467 | $316,373 | $253,094 |
| 2023 | $6,504 | $558,301 | $310,169 | $248,132 |
| 2022 | $6,318 | $547,354 | $304,087 | $243,267 |
| 2021 | $6,300 | $536,622 | $298,124 | $238,498 |
| 2020 | $6,271 | $531,121 | $295,068 | $236,053 |
| 2019 | $5,927 | $520,708 | $289,283 | $231,425 |
| 2018 | $5,852 | $510,499 | $283,611 | $226,888 |
| 2017 | $5,921 | $500,490 | $278,050 | $222,440 |
| 2016 | $5,563 | $490,678 | $272,599 | $218,079 |
| 2015 | $5,319 | $483,309 | $268,505 | $214,804 |
| 2014 | $5,394 | $473,000 | $262,000 | $211,000 |
Source: Public Records
Map
Nearby Homes
- 179 View Dr
- 549 Glade Dr
- 417 N 8th St
- 426 N Palm Ave
- 738 E Santa Paula St
- 180 E Pleasant St
- 214 N 7th St
- 838 Crestview Ct
- 916 E Santa Paula St
- 933 E Santa Paula St
- 864 Montclair Dr
- 975 Loma Vista Place
- 622 N Mill St
- 815 Vista Grande Dr
- 317 N Ojai St #Abcde
- 209 W Santa Barbara St
- 229 Wakeford Ave
- 129 E Ventura St Unit A
- 201 E Ventura St
- 573 Eureka Dr
- 530 E View Dr
- 587 E Virginia Terrace
- 600 Teague Dr
- 559 E Virginia Terrace
- 589 E View Dr
- 516 E View Dr
- 557 E View Dr
- 481 N 6th St
- 519 E Virginia Terrace
- 605 Teague Dr
- 517 E View Dr
- 614 Teague Dr
- 468 E View Dr
- 540 N 6th St
- 611 E Virginia Terrace
- 467 E Virginia Terrace
- 622 E Virginia Terrace
- 469 E View Dr
- 615 Teague Dr
- 625 E Virginia Terrace
Your Personal Tour Guide
Ask me questions while you tour the home.