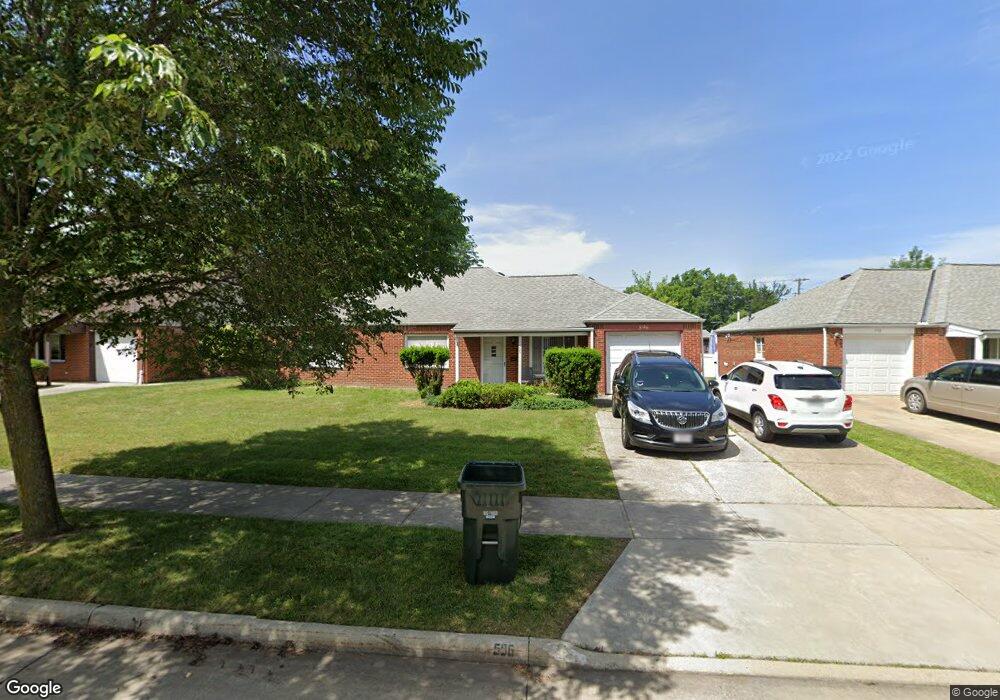
596 Hemlock Dr Euclid, OH 44132
Estimated Value: $177,907 - $204,000
3
Beds
2
Baths
1,731
Sq Ft
$108/Sq Ft
Est. Value
About This Home
This home is located at 596 Hemlock Dr, Euclid, OH 44132 and is currently estimated at $186,977, approximately $108 per square foot. 596 Hemlock Dr is a home located in Cuyahoga County with nearby schools including Shoreview Elementary School, Euclid High School, and Mater Dei Academy.
Ownership History
Date
Name
Owned For
Owner Type
Purchase Details
Closed on
Jul 10, 2003
Sold by
Apicello Frank
Bought by
Larue Janet
Current Estimated Value
Home Financials for this Owner
Home Financials are based on the most recent Mortgage that was taken out on this home.
Original Mortgage
$91,920
Outstanding Balance
$37,323
Interest Rate
5.36%
Mortgage Type
Purchase Money Mortgage
Estimated Equity
$149,654
Purchase Details
Closed on
Feb 1, 1984
Sold by
Apicello Frank and Apicello Audrey
Bought by
Apicello Frank
Purchase Details
Closed on
Jan 1, 1975
Bought by
Apicello Frank and Apicello Audrey
Create a Home Valuation Report for This Property
The Home Valuation Report is an in-depth analysis detailing your home's value as well as a comparison with similar homes in the area
Home Values in the Area
Average Home Value in this Area
Purchase History
| Date | Buyer | Sale Price | Title Company |
|---|---|---|---|
| Larue Janet | $114,900 | Real Estate Title | |
| Apicello Frank | -- | -- | |
| Apicello Frank | -- | -- |
Source: Public Records
Mortgage History
| Date | Status | Borrower | Loan Amount |
|---|---|---|---|
| Open | Larue Janet | $91,920 | |
| Closed | Larue Janet | $11,490 |
Source: Public Records
Tax History
| Year | Tax Paid | Tax Assessment Tax Assessment Total Assessment is a certain percentage of the fair market value that is determined by local assessors to be the total taxable value of land and additions on the property. | Land | Improvement |
|---|---|---|---|---|
| 2025 | $3,033 | $56,490 | $10,080 | $46,410 |
| 2024 | $3,227 | $56,490 | $10,080 | $46,410 |
| 2023 | $2,880 | $42,290 | $8,930 | $33,360 |
| 2022 | $2,848 | $42,280 | $8,925 | $33,355 |
| 2021 | $3,163 | $42,280 | $8,930 | $33,360 |
| 2020 | $2,450 | $32,030 | $6,760 | $25,270 |
| 2019 | $2,203 | $91,500 | $19,300 | $72,200 |
| 2018 | $2,558 | $32,030 | $6,760 | $25,270 |
| 2017 | $2,207 | $28,010 | $5,430 | $22,580 |
| 2016 | $2,212 | $28,010 | $5,430 | $22,580 |
| 2015 | $2,864 | $28,010 | $5,430 | $22,580 |
| 2014 | $2,864 | $28,010 | $5,430 | $22,580 |
Source: Public Records
Map
Nearby Homes
- 597 Hemlock Dr
- 591 Hemlock Dr
- 670 Hemlock Dr
- 27190 Zeman Ave
- 730 Hemlock Dr
- 26931 Shoreview Ave
- 26831 Shoreview Ave
- 610 E 266th St
- 440 E 271st St
- 26530 Shoreview Ave
- 29136 Norman Ave
- 815 E 272nd St
- 411 E 270th St
- 26430 Drakefield Ave
- 625 Lloyd Rd
- 427 E 275th St
- 26171 Shoreview Ave
- 953 Bryn Mawr Ave
- 643 E 261st St
- 571 E 260th St
Your Personal Tour Guide
Ask me questions while you tour the home.