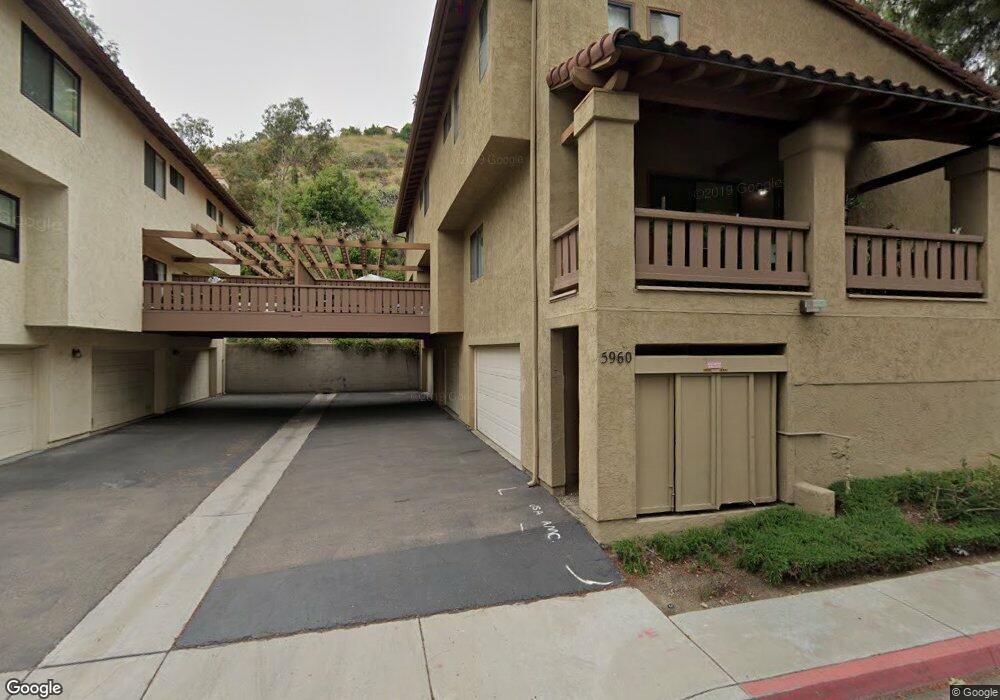
5960 Mission Center Rd Unit A San Diego, CA 92123
Birdland NeighborhoodEstimated Value: $751,000 - $816,000
2
Beds
3
Baths
1,480
Sq Ft
$528/Sq Ft
Est. Value
About This Home
This home is located at 5960 Mission Center Rd Unit A, San Diego, CA 92123 and is currently estimated at $781,573, approximately $528 per square foot. 5960 Mission Center Rd Unit A is a home located in San Diego County with nearby schools including Nipaquay Elementary, Fletcher Elementary School, and Montgomery Middle School.
Ownership History
Date
Name
Owned For
Owner Type
Purchase Details
Closed on
Sep 10, 2003
Sold by
Jordan Richard and Jordan Wendy S
Bought by
Soto Hector and Soto Lilia
Current Estimated Value
Home Financials for this Owner
Home Financials are based on the most recent Mortgage that was taken out on this home.
Original Mortgage
$304,000
Interest Rate
5.98%
Mortgage Type
Purchase Money Mortgage
Purchase Details
Closed on
Jun 6, 2001
Sold by
Jordan Richard and Jordan Wendy S
Bought by
Jordan Richard and Jordan Wendy S
Home Financials for this Owner
Home Financials are based on the most recent Mortgage that was taken out on this home.
Original Mortgage
$227,000
Interest Rate
7.14%
Mortgage Type
Balloon
Purchase Details
Closed on
Aug 21, 2000
Sold by
Barron John P
Bought by
Jordan Richard and Devinger Wendy
Home Financials for this Owner
Home Financials are based on the most recent Mortgage that was taken out on this home.
Original Mortgage
$224,650
Interest Rate
8.07%
Mortgage Type
Purchase Money Mortgage
Purchase Details
Closed on
Jun 11, 1992
Purchase Details
Closed on
Feb 25, 1986
Create a Home Valuation Report for This Property
The Home Valuation Report is an in-depth analysis detailing your home's value as well as a comparison with similar homes in the area
Home Values in the Area
Average Home Value in this Area
Purchase History
| Date | Buyer | Sale Price | Title Company |
|---|---|---|---|
| Soto Hector | $380,000 | Southland Title | |
| Jordan Richard | -- | United Title Company | |
| Jordan Richard | $236,500 | United Title Company | |
| -- | $184,000 | -- | |
| -- | $118,900 | -- |
Source: Public Records
Mortgage History
| Date | Status | Borrower | Loan Amount |
|---|---|---|---|
| Previous Owner | Soto Hector | $304,000 | |
| Previous Owner | Jordan Richard | $227,000 | |
| Previous Owner | Jordan Richard | $224,650 |
Source: Public Records
Tax History Compared to Growth
Tax History
| Year | Tax Paid | Tax Assessment Tax Assessment Total Assessment is a certain percentage of the fair market value that is determined by local assessors to be the total taxable value of land and additions on the property. | Land | Improvement |
|---|---|---|---|---|
| 2025 | $6,451 | $540,255 | $284,345 | $255,910 |
| 2024 | $6,451 | $529,663 | $278,770 | $250,893 |
| 2023 | $6,307 | $519,278 | $273,304 | $245,974 |
| 2022 | $6,138 | $509,097 | $267,946 | $241,151 |
| 2021 | $6,094 | $499,116 | $262,693 | $236,423 |
| 2020 | $6,020 | $493,999 | $260,000 | $233,999 |
| 2019 | $5,911 | $484,313 | $254,902 | $229,411 |
| 2018 | $5,525 | $474,817 | $249,904 | $224,913 |
| 2017 | $80 | $440,000 | $229,000 | $211,000 |
| 2016 | $4,702 | $405,000 | $211,000 | $194,000 |
| 2015 | $4,350 | $375,000 | $196,000 | $179,000 |
| 2014 | $4,014 | $345,000 | $181,000 | $164,000 |
Source: Public Records
Map
Nearby Homes
- 5806 Mission Center Rd Unit C
- 2015 Ainsley Rd
- 2045 Cardinal Dr
- 2130 Cardinal Dr
- 2432 Aperture Cir
- 2472 Aperture Cir
- 7786 Stylus Dr
- 2335 Aperture Cir
- 7774 Stylus Dr
- 8355 Summit Way
- 2321 Cardinal Dr
- 7830 Inception Way
- 8353 Distinctive Dr
- 8363 Distinctive Dr
- 7810 Inception Way
- 7887 Stylus Dr
- 7859 Stylus Dr
- 2470 Via Alta
- 2567 Pheasant Dr
- 7625 Teebird Ln
- 5960 Mission Center Rd
- 5960 Mission Center Rd Unit C
- 5960 Mission Center Rd Unit B
- 5930 Mission Center Rd Unit B
- 5910 Mission Center Rd Unit A
- 5910 Mission Center Rd Unit B
- 5930 Mission Center Rd Unit A
- 5930 Mission Center Rd Unit C
- 5940 Mission Center Rd Unit B
- 5940 Mission Center Rd Unit A
- 0 Mission Center Rd Unit 130041855
- 0 Mission Center Rd Unit 130046086
- 5950 Mission Center Rd Unit A
- 5950 Mission Center Rd Unit B
- 5950 Mission Center Rd Unit C
- 5970 Mission Center Rd Unit A
- 5970 Mission Center Rd Unit B
- 5920 Mission Center Rd
- 5920 Mission Center Rd Unit B
- 5920 Mission Center Rd Unit A