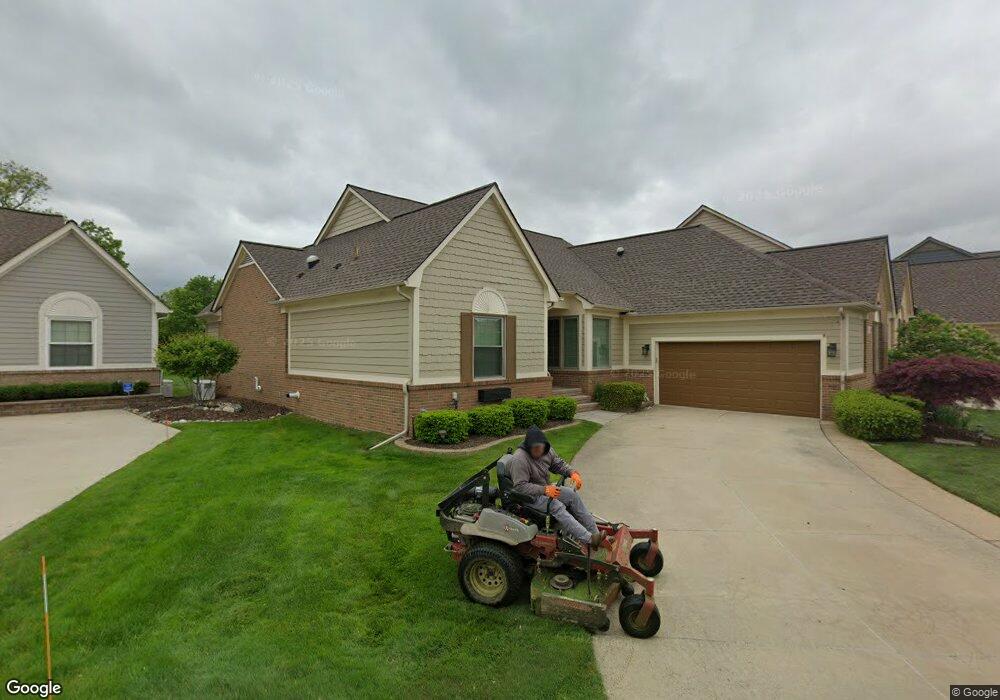
59685 Glacier Pointe Unit 33 Washington, MI 48094
Estimated Value: $466,000 - $625,000
2
Beds
2
Baths
1,884
Sq Ft
$281/Sq Ft
Est. Value
About This Home
This home is located at 59685 Glacier Pointe Unit 33, Washington, MI 48094 and is currently estimated at $528,934, approximately $280 per square foot. 59685 Glacier Pointe Unit 33 is a home located in Macomb County with nearby schools including Indian Hills Elementary School and Cross Of Glory Lutheran School.
Ownership History
Date
Name
Owned For
Owner Type
Purchase Details
Closed on
Dec 16, 2021
Sold by
Joan Keller-Herman
Bought by
Joan E Keller-Herman Trust
Current Estimated Value
Purchase Details
Closed on
Dec 30, 2014
Sold by
Herman William C
Bought by
Kellerherman Joan and Kellerherman H
Purchase Details
Closed on
Jun 5, 2006
Sold by
Herman William C and Keller Herman Joan E
Bought by
Herman William and William C Herman Trust
Purchase Details
Closed on
Aug 10, 2005
Sold by
Ferrazza David R and Ferrazza Patricia J
Bought by
Herman William C
Purchase Details
Closed on
Aug 4, 2000
Sold by
Glacier Development Co I
Bought by
Ferrazza David R
Home Financials for this Owner
Home Financials are based on the most recent Mortgage that was taken out on this home.
Original Mortgage
$187,000
Interest Rate
8.16%
Create a Home Valuation Report for This Property
The Home Valuation Report is an in-depth analysis detailing your home's value as well as a comparison with similar homes in the area
Home Values in the Area
Average Home Value in this Area
Purchase History
| Date | Buyer | Sale Price | Title Company |
|---|---|---|---|
| Joan E Keller-Herman Trust | -- | None Listed On Document | |
| Kellerherman Joan | $116 | -- | |
| Herman William C | $116 | -- | |
| Herman William | -- | None Available | |
| Herman William C | $275,000 | Metropolitan Title Company | |
| Ferrazza David R | $65,000 | -- |
Source: Public Records
Mortgage History
| Date | Status | Borrower | Loan Amount |
|---|---|---|---|
| Previous Owner | Ferrazza David R | $187,000 |
Source: Public Records
Tax History Compared to Growth
Tax History
| Year | Tax Paid | Tax Assessment Tax Assessment Total Assessment is a certain percentage of the fair market value that is determined by local assessors to be the total taxable value of land and additions on the property. | Land | Improvement |
|---|---|---|---|---|
| 2025 | $4,155 | $234,700 | $0 | $0 |
| 2024 | $2,807 | $221,600 | $0 | $0 |
| 2023 | $2,706 | $231,300 | $0 | $0 |
| 2022 | $3,759 | $205,800 | $0 | $0 |
| 2021 | $3,678 | $198,100 | $0 | $0 |
| 2020 | $2,505 | $191,400 | $0 | $0 |
| 2019 | $3,375 | $176,900 | $0 | $0 |
| 2018 | $3,307 | $165,200 | $0 | $0 |
| 2017 | $3,189 | $150,300 | $47,500 | $102,800 |
| 2016 | $3,194 | $150,300 | $0 | $0 |
| 2015 | -- | $147,400 | $0 | $0 |
| 2013 | $2,957 | $116,500 | $24,400 | $92,100 |
| 2012 | $2,957 | $100,800 | $0 | $0 |
Source: Public Records
Map
Nearby Homes
- 6933 Boulder Pointe Dr Unit 59
- 00 Oakridge Dr
- 59601 Van Dyke Rd
- 6797 Boulder Pointe Dr Unit 25
- 6725 Boulder Pointe Dr Unit 7
- 6713 Boulder Pointe Dr Unit 4
- 6109 Whispering Oak Dr
- 60023 Trailwood St
- 7966 Firestone Ln Unit 44
- 00 28 Mile
- schoenherr SE Rd SE
- 29 Mile
- 58144 Pheasant Ridge
- 58152 Carbine
- 60975 Stonecrest Dr
- 7721 Marble Ct
- 8400 27 Mile Rd Unit Lot 2
- 8400 27 Mile Rd Unit Lot 1
- 7427 Emerson
- 8699 Pioneer St
- 59673 Glacier Pointe
- 59697 Glacier Pointe Unit Bldg-Unit
- 59697 Glacier Pointe
- 59709 Glacier Pointe
- 59661 Glacier Pointe
- 59712 Glacier Ct
- 59712 Glacier Ct Unit 40
- 59724 Glacier Ct
- 59698 Glacier Pointe
- 59686 Glacier Pointe
- 59721 Glacier Pointe Unit 36
- 59674 Glacier Pointe
- 59662 Glacier Pointe
- 59650 Glacier Pointe
- 59736 Glacier Ct
- 59700 Glacier Ct Unit 41
- 59710 Glacier Pointe Unit 25
- 59807 Glacier Ridge N
- 59648 Glacier Ridge S Unit 8
- 59672 Glacier Ridge S