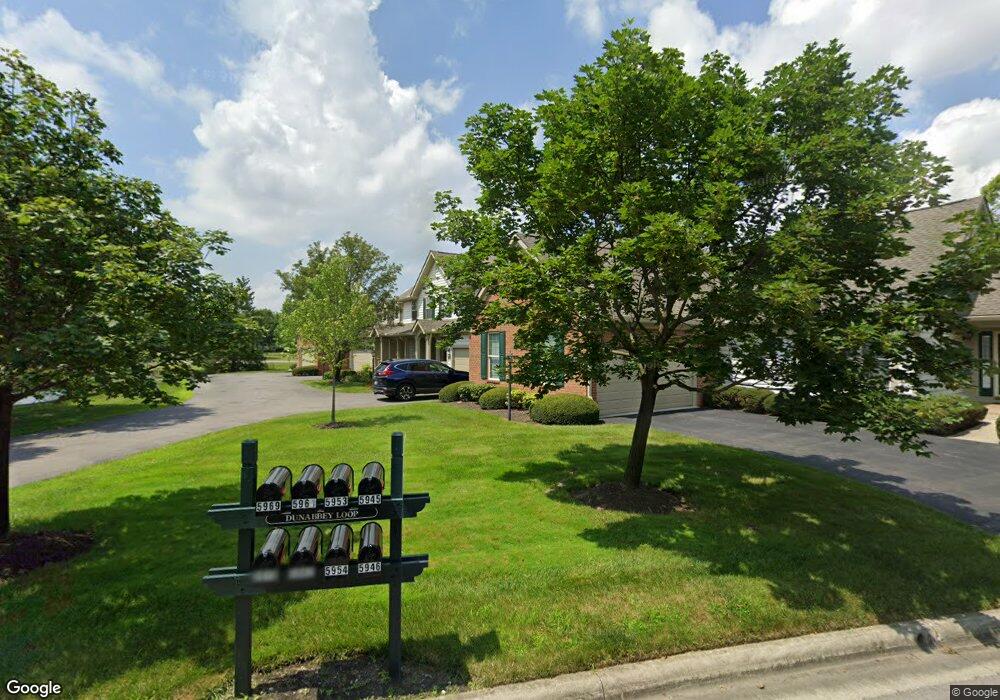
5970 Dunabbey Loop Unit 5970 Dublin, OH 43017
Estimated Value: $451,000 - $527,000
2
Beds
3
Baths
1,936
Sq Ft
$249/Sq Ft
Est. Value
About This Home
This home is located at 5970 Dunabbey Loop Unit 5970, Dublin, OH 43017 and is currently estimated at $481,699, approximately $248 per square foot. 5970 Dunabbey Loop Unit 5970 is a home located in Franklin County with nearby schools including Wyandot Elementary School, Henry Karrer Middle School, and Dublin Coffman High School.
Ownership History
Date
Name
Owned For
Owner Type
Purchase Details
Closed on
Feb 19, 2018
Sold by
Francis David A and Francis Carole R
Bought by
Francis David S and Francis Douglas M
Current Estimated Value
Purchase Details
Closed on
May 31, 2007
Sold by
Rover Doris
Bought by
Francis David A and Francis Carole R
Home Financials for this Owner
Home Financials are based on the most recent Mortgage that was taken out on this home.
Original Mortgage
$255,000
Outstanding Balance
$153,073
Interest Rate
6.2%
Mortgage Type
Purchase Money Mortgage
Estimated Equity
$328,626
Purchase Details
Closed on
Sep 29, 1999
Sold by
Duffy Homes Inc
Bought by
Rover Doris
Home Financials for this Owner
Home Financials are based on the most recent Mortgage that was taken out on this home.
Original Mortgage
$174,400
Interest Rate
7.93%
Create a Home Valuation Report for This Property
The Home Valuation Report is an in-depth analysis detailing your home's value as well as a comparison with similar homes in the area
Home Values in the Area
Average Home Value in this Area
Purchase History
| Date | Buyer | Sale Price | Title Company |
|---|---|---|---|
| Francis David S | -- | None Available | |
| Francis David A | $255,000 | Chicago Tit | |
| Rover Doris | $234,400 | Title First Agency Inc |
Source: Public Records
Mortgage History
| Date | Status | Borrower | Loan Amount |
|---|---|---|---|
| Open | Francis David A | $255,000 | |
| Closed | Rover Doris | $174,400 |
Source: Public Records
Tax History
| Year | Tax Paid | Tax Assessment Tax Assessment Total Assessment is a certain percentage of the fair market value that is determined by local assessors to be the total taxable value of land and additions on the property. | Land | Improvement |
|---|---|---|---|---|
| 2025 | $8,132 | $134,960 | $29,750 | $105,210 |
| 2024 | $8,132 | $134,960 | $29,750 | $105,210 |
| 2023 | $8,059 | $134,960 | $29,750 | $105,210 |
| 2022 | $6,363 | $99,540 | $17,920 | $81,620 |
| 2021 | $6,379 | $99,540 | $17,920 | $81,620 |
| 2020 | $6,432 | $99,540 | $17,920 | $81,620 |
| 2019 | $6,547 | $90,480 | $16,280 | $74,200 |
| 2018 | $3,287 | $90,480 | $16,280 | $74,200 |
| 2017 | $6,092 | $90,480 | $16,280 | $74,200 |
| 2016 | $6,044 | $84,880 | $16,630 | $68,250 |
| 2015 | $3,042 | $84,880 | $16,630 | $68,250 |
| 2014 | $6,091 | $84,880 | $16,630 | $68,250 |
| 2013 | $3,099 | $84,875 | $16,625 | $68,250 |
Source: Public Records
Map
Nearby Homes
- 5859 Dunabbey Loop Unit 5859
- 5987 Dunabbey Loop
- 7886 Nassau Loop
- 5600 Caplestone Ln
- 7645 Fulmar Dr
- 7684 Quetzal Dr
- 6170 Balmoral Dr
- 6031 Cromdale Dr
- 7495 Whigham Ct
- 8048 Lombard Way
- 7199 Achill Dr
- 8552 Cartney Ct
- 6050 Kentigern Ct S
- 7195 Dominick Ct
- 7081 Wendy Trail Ln
- 7825 Wiltshire Dr
- 6341 Tara Hill Dr
- 5504 Old Pond Dr
- 6258 Wexford Woods Dr
- 5202 Reddington Dr
- 5962 Dunabbey Loop
- 5954 Dunabbey Loop Unit 5954
- 5938 Dunliam Place Unit 5938
- 5930 Dunliam Place Unit 5930
- 5930 Dunliam Place Unit Bldg 11
- 5946 Dunabbey Loop Unit 5946
- 5946 Dunabbey Loop Unit Bldg 12
- 5922 Dunliam Place Unit 5922
- 5914 Dunliam Place Unit 5914
- 5905 Dunabbey Loop Unit 5905
- 5945 Dunabbey Loop Unit 5945
- 5897 Dunabbey Loop Unit 5897
- 5897 Dunabbey Loop Unit Bldg 17
- 5961 Dunabbey Loop Unit 5961
- 5889 Dunabbey Loop Unit 5889
- 5969 Dunabbey Loop Unit 5969
- 5969 Dunabbey Loop Unit Bldg 16
- 5882 Dunliam Place Unit 5882
- 5881 Dunabbey Loop Unit 5881
- 5913 Dunabbey Loop Unit 5913
Your Personal Tour Guide
Ask me questions while you tour the home.