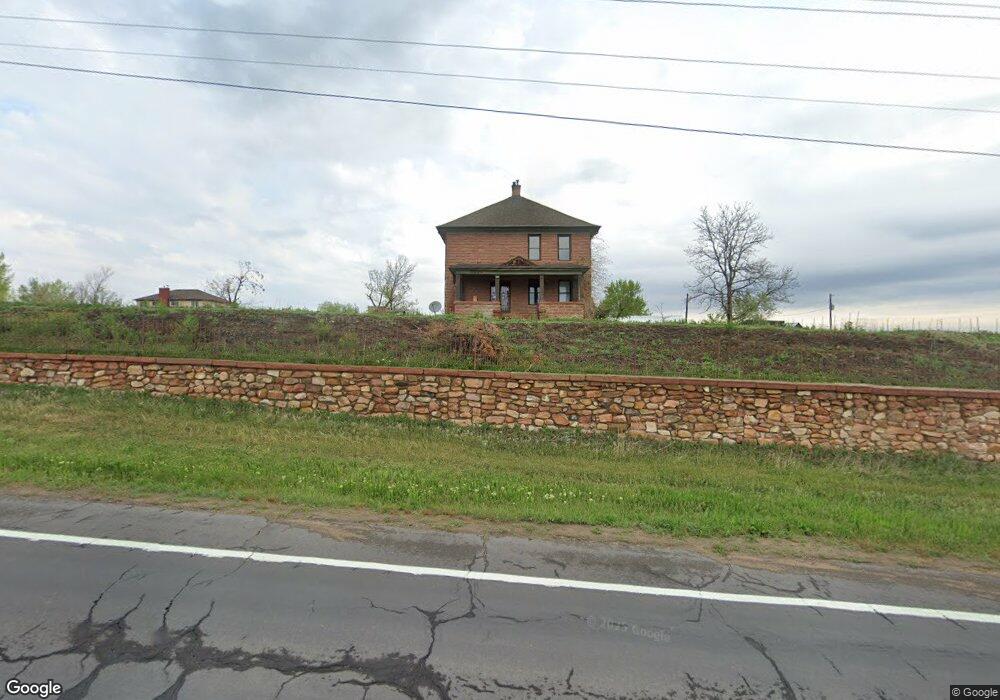
5973 Nelson Rd Longmont, CO 80503
Estimated Value: $1,378,000 - $1,544,861
4
Beds
2
Baths
3,192
Sq Ft
$462/Sq Ft
Est. Value
About This Home
This home is located at 5973 Nelson Rd, Longmont, CO 80503 and is currently estimated at $1,473,215, approximately $461 per square foot. 5973 Nelson Rd is a home located in Boulder County with nearby schools including Blue Mountain Elementary School, Altona Middle School, and Silver Creek High School.
Ownership History
Date
Name
Owned For
Owner Type
Purchase Details
Closed on
Oct 4, 2018
Sold by
Rubin Gary R
Bought by
Khamer Laasn Llc
Current Estimated Value
Purchase Details
Closed on
Apr 14, 1998
Sold by
Degraffenried Joseph C
Bought by
Joseph C Degraffenried Management Trust
Purchase Details
Closed on
Nov 24, 1997
Sold by
Cook Brun Max and Cook Curtine Metcalf
Bought by
Brun Max
Home Financials for this Owner
Home Financials are based on the most recent Mortgage that was taken out on this home.
Original Mortgage
$268,000
Interest Rate
7.31%
Purchase Details
Closed on
Apr 19, 1995
Sold by
Table Mountain Ranch Estates
Bought by
Brun Max
Home Financials for this Owner
Home Financials are based on the most recent Mortgage that was taken out on this home.
Original Mortgage
$167,000
Interest Rate
8.53%
Purchase Details
Closed on
Feb 17, 1994
Sold by
Colorado General Partnership
Bought by
Degraffenried Joseph C
Create a Home Valuation Report for This Property
The Home Valuation Report is an in-depth analysis detailing your home's value as well as a comparison with similar homes in the area
Home Values in the Area
Average Home Value in this Area
Purchase History
| Date | Buyer | Sale Price | Title Company |
|---|---|---|---|
| Khamer Laasn Llc | -- | None Available | |
| Khamer Laasn Llc | -- | None Available | |
| Joseph C Degraffenried Management Trust | -- | -- | |
| Brun Max | -- | -- | |
| Brun Max | $229,000 | First American Heritage Titl | |
| Degraffenried Joseph C | $172,500 | -- |
Source: Public Records
Mortgage History
| Date | Status | Borrower | Loan Amount |
|---|---|---|---|
| Previous Owner | Brun Max | $268,000 | |
| Previous Owner | Brun Max | $167,000 | |
| Closed | Brun Max | $39,100 |
Source: Public Records
Tax History Compared to Growth
Tax History
| Year | Tax Paid | Tax Assessment Tax Assessment Total Assessment is a certain percentage of the fair market value that is determined by local assessors to be the total taxable value of land and additions on the property. | Land | Improvement |
|---|---|---|---|---|
| 2025 | $8,734 | $96,069 | $57,063 | $39,006 |
| 2024 | $8,734 | $96,069 | $57,063 | $39,006 |
| 2023 | $8,586 | $97,619 | $33,714 | $67,590 |
| 2022 | $6,613 | $74,321 | $30,191 | $44,130 |
| 2021 | $6,627 | $76,461 | $31,060 | $45,401 |
| 2020 | $4,582 | $56,150 | $28,672 | $27,478 |
| 2019 | $4,504 | $56,150 | $28,672 | $27,478 |
| 2018 | $4,139 | $52,503 | $25,272 | $27,231 |
| 2017 | $4,034 | $58,046 | $27,940 | $30,106 |
| 2016 | $4,621 | $51,415 | $24,278 | $27,137 |
| 2015 | $4,235 | $43,780 | $20,298 | $23,482 |
| 2014 | $3,711 | $43,780 | $20,298 | $23,482 |
Source: Public Records
Map
Nearby Homes
- 10619 N 65th St
- 6231 Prospect Rd
- 8586 N 55th St
- 8418 Stirrup Ln
- 5101 Saint Vrain Rd
- 7373 Nelson Rd
- 6880 Saint Vrain Rd
- 10077 N 75th St
- 9231 Tollgate Dr
- 5595 Wheaton Ave
- 733 Kubat Ln Unit B
- 1106 Redbud Cir
- 729 Kubat Ln Unit A
- 750 Kubat Ln Unit B
- 751 W Grange Ct Unit A
- 5717 Four Leaf Dr
- 5605 Mount Sanitas Ave
- 5616 Wheaton Ave
- 5610 Four Leaf Dr
- 5611 Wheaton Ave
- 5977 Nelson Rd
- 5997 Nelson Rd
- 5555 Nelson Rd
- 10075 N 65th St
- 0 N 65th St
- 5392 Nelson Rd
- 9421 N 63rd St
- 10073 N 65th St
- 9647 N 63rd St
- 10333 Galatia Ct
- 9641 N 63rd St
- 10071 N 65th St
- 10219 Macedonia St
- 6256 Galatia Rd
- 10365 Galatia Ct
- 10226 Macedonia St
- 10261 Macedonia St
- 9535 N 63rd St
- 10069 N 65th St
- 5800 Galatia Rd