J
Landlord's Agent in 2022
Jeremy Tallman
T&H Realty Services, Inc.
Estimated Value: $213,000 - $240,000
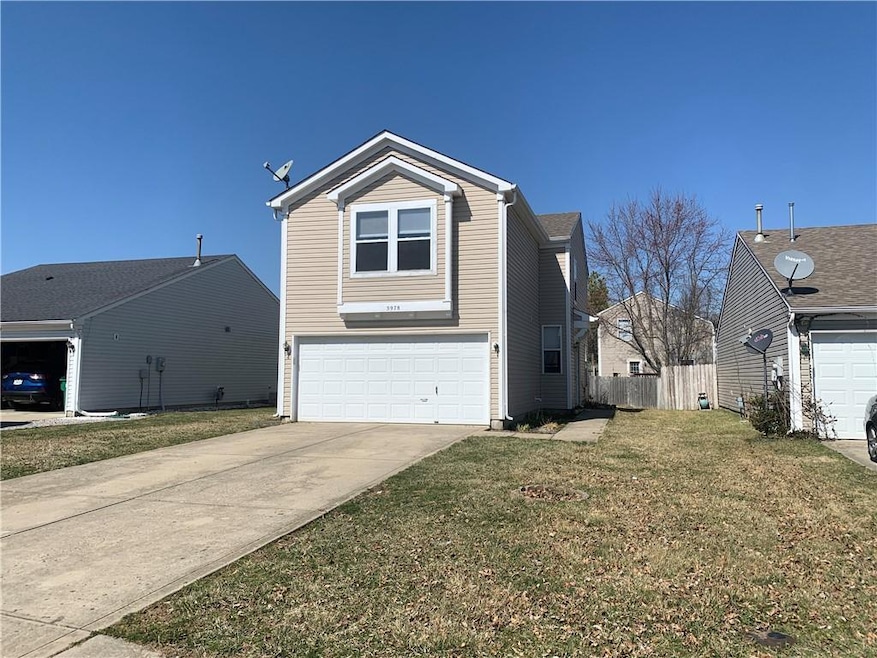
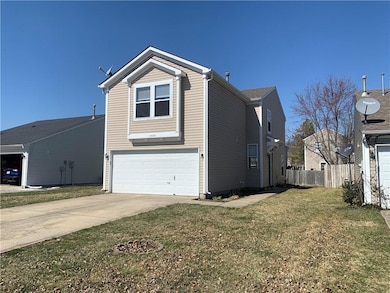
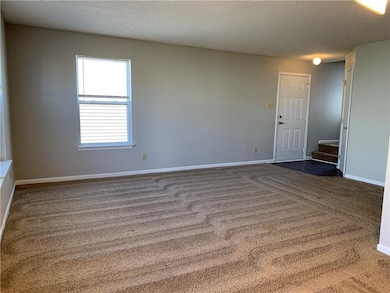
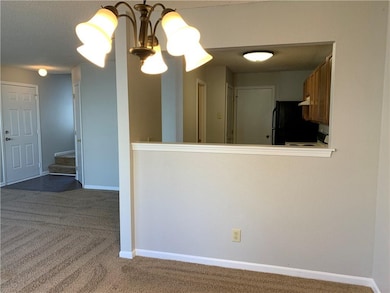
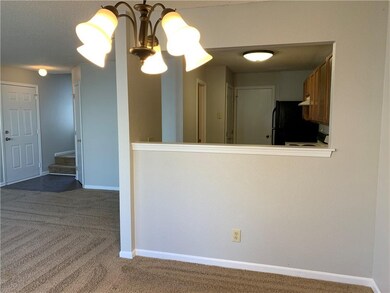
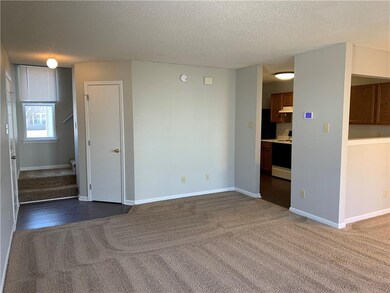
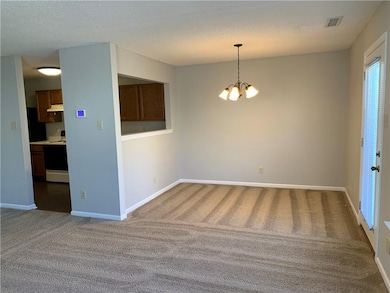
Roomy two-Story in Plainfield off US40 minutes to Oak Tree Golf Course, Perry Crossing and more! Home features 3 bedrooms, 2.5 bath plus loft! Great for added living space or home office. Enjoy the galley kitchen with lots of cabinet space. Fantastic, large backyard. 2-car garage. Pets Negotiable! Note: In addition to the monthly rent, Tenant will pay an additional $35 each month for a Tenant Benefits Package. Details can be found here: www.threaltyinc.com/tbp
Last Agent to Rent the Property
Jeremy Tallman
T&H Realty Services, Inc. Listed on: 03/16/2022

Co-Listed By
Claire Holdsworth
JUST LIV, LLC
Last Renter's Agent
Claire Holdsworth
JUST LIV, LLC
| Date | Buyer | Sale Price | Title Company |
|---|---|---|---|
| Hsu Joseph | -- | None Available | |
| Howard Billy W | -- | None Available |
| Date | Status | Borrower | Loan Amount |
|---|---|---|---|
| Open | Hsu Joseph | $110,250 | |
| Previous Owner | Howard Billy W | $89,233 |
| Date | Event | Price | List to Sale | Price per Sq Ft | Prior Sale |
|---|---|---|---|---|---|
| 04/01/2022 04/01/22 | Rented | $1,500 | 0.0% | -- | |
| 03/30/2022 03/30/22 | Under Contract | -- | -- | -- | |
| 03/16/2022 03/16/22 | For Rent | $1,500 | +11.1% | -- | |
| 04/24/2021 04/24/21 | Rented | $1,350 | 0.0% | -- | |
| 04/22/2021 04/22/21 | Under Contract | -- | -- | -- | |
| 04/12/2021 04/12/21 | For Rent | $1,350 | 0.0% | -- | |
| 04/01/2021 04/01/21 | Under Contract | -- | -- | -- | |
| 03/29/2021 03/29/21 | For Rent | $1,350 | 0.0% | -- | |
| 03/25/2021 03/25/21 | Under Contract | -- | -- | -- | |
| 03/24/2021 03/24/21 | For Rent | $1,350 | 0.0% | -- | |
| 02/12/2021 02/12/21 | Sold | $147,000 | -2.0% | $101 / Sq Ft | View Prior Sale |
| 01/10/2021 01/10/21 | Pending | -- | -- | -- | |
| 01/10/2021 01/10/21 | For Sale | $150,000 | -- | $103 / Sq Ft |
| Year | Tax Paid | Tax Assessment Tax Assessment Total Assessment is a certain percentage of the fair market value that is determined by local assessors to be the total taxable value of land and additions on the property. | Land | Improvement |
|---|---|---|---|---|
| 2024 | $3,047 | $157,100 | $28,000 | $129,100 |
| 2023 | $3,037 | $152,400 | $26,600 | $125,800 |
| 2022 | $1,866 | $93,300 | $16,300 | $77,000 |
| 2021 | $608 | $93,300 | $17,500 | $75,800 |
| 2020 | $941 | $119,600 | $24,100 | $95,500 |
| 2019 | $848 | $113,100 | $22,900 | $90,200 |
| 2018 | $816 | $108,600 | $22,900 | $85,700 |
| 2017 | $684 | $95,900 | $22,500 | $73,400 |
| 2016 | $675 | $95,400 | $22,500 | $72,900 |
| 2014 | $615 | $89,500 | $20,800 | $68,700 |
J
Landlord's Agent in 2022
Jeremy Tallman
T&H Realty Services, Inc.
C
Landlord's Co-Listing Agent in 2022
Claire Holdsworth
JUST LIV, LLC
Seller's Agent in 2021
Magi Strickler
CrestPoint Real Estate
(317) 478-6624
22 in this area
97 Total Sales
P
Buyer's Agent in 2021
Patrick Keller
CrestPoint Real Estate
Source: MIBOR Broker Listing Cooperative®
MLS Number: 21843466
APN: 32-10-27-364-008.000-012
Disclaimer: Certain information contained herein is derived from information provided by parties other than Homes.com. All information provided is deemed reliable, but is not guaranteed to be accurate and should be independently verified.
![]() Based on information submitted to the MLS GRID. All data is obtained from various sources and may not have been verified by broker or MLS GRID. Supplied Open House Information is subject to change without notice. All information should be independently reviewed and verified for accuracy. Properties may or may not be listed by the office/agent presenting the information. Some IDX listings have been excluded from this website.
Based on information submitted to the MLS GRID. All data is obtained from various sources and may not have been verified by broker or MLS GRID. Supplied Open House Information is subject to change without notice. All information should be independently reviewed and verified for accuracy. Properties may or may not be listed by the office/agent presenting the information. Some IDX listings have been excluded from this website.