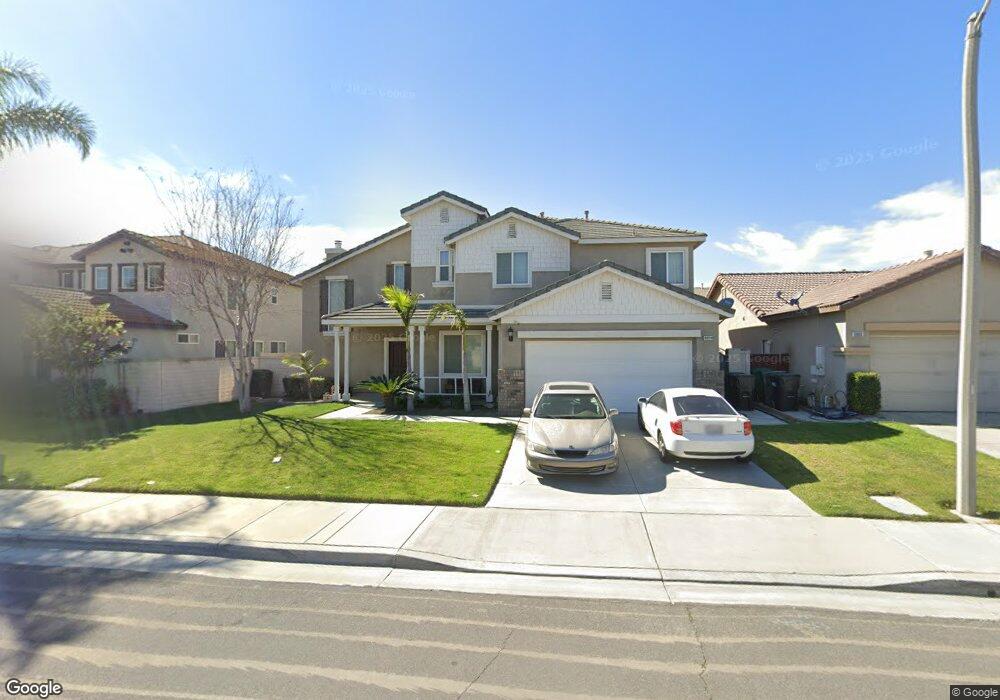
5979 Maycrest Ave Corona, CA 92880
Estimated Value: $780,624 - $880,000
4
Beds
3
Baths
2,031
Sq Ft
$413/Sq Ft
Est. Value
About This Home
This home is located at 5979 Maycrest Ave, Corona, CA 92880 and is currently estimated at $838,656, approximately $412 per square foot. 5979 Maycrest Ave is a home located in Riverside County with nearby schools including Rosa Parks Elementary School, Dr. Augustine Ramirez Intermediate School, and Eleanor Roosevelt High School.
Ownership History
Date
Name
Owned For
Owner Type
Purchase Details
Closed on
Nov 18, 2005
Sold by
Nguyen Tuyen Ngoc
Bought by
Tuyen Ngoc Nguyen Living Trust
Current Estimated Value
Purchase Details
Closed on
Apr 20, 2005
Sold by
Le Hai Phuoc
Bought by
Nguyen Tuyen Ngoc
Purchase Details
Closed on
Aug 6, 2003
Sold by
Le Hai Phuoc
Bought by
Nguyen Tuyen Ngoc
Home Financials for this Owner
Home Financials are based on the most recent Mortgage that was taken out on this home.
Original Mortgage
$248,391
Outstanding Balance
$95,386
Interest Rate
3.87%
Mortgage Type
Purchase Money Mortgage
Estimated Equity
$743,270
Purchase Details
Closed on
Jul 31, 2003
Sold by
Western Pacific Housing Inc
Bought by
Nguyen Tuyen Ngoc
Home Financials for this Owner
Home Financials are based on the most recent Mortgage that was taken out on this home.
Original Mortgage
$248,391
Outstanding Balance
$95,386
Interest Rate
3.87%
Mortgage Type
Purchase Money Mortgage
Estimated Equity
$743,270
Create a Home Valuation Report for This Property
The Home Valuation Report is an in-depth analysis detailing your home's value as well as a comparison with similar homes in the area
Home Values in the Area
Average Home Value in this Area
Purchase History
| Date | Buyer | Sale Price | Title Company |
|---|---|---|---|
| Tuyen Ngoc Nguyen Living Trust | -- | -- | |
| Nguyen Tuyen Ngoc | -- | First American Title Company | |
| Nguyen Tuyen Ngoc | -- | First American Title Co | |
| Nguyen Tuyen Ngoc | $276,000 | First American Title Co |
Source: Public Records
Mortgage History
| Date | Status | Borrower | Loan Amount |
|---|---|---|---|
| Open | Nguyen Tuyen Ngoc | $248,391 |
Source: Public Records
Tax History
| Year | Tax Paid | Tax Assessment Tax Assessment Total Assessment is a certain percentage of the fair market value that is determined by local assessors to be the total taxable value of land and additions on the property. | Land | Improvement |
|---|---|---|---|---|
| 2025 | $6,084 | $392,392 | $106,622 | $285,770 |
| 2023 | $6,084 | $377,157 | $102,483 | $274,674 |
| 2022 | $5,975 | $369,763 | $100,474 | $269,289 |
| 2021 | $5,880 | $362,513 | $98,504 | $264,009 |
| 2020 | $5,805 | $358,796 | $97,494 | $261,302 |
| 2019 | $5,974 | $351,762 | $95,583 | $256,179 |
| 2018 | $5,855 | $344,865 | $93,709 | $251,156 |
| 2017 | $5,763 | $338,104 | $91,872 | $246,232 |
| 2016 | $5,683 | $331,475 | $90,071 | $241,404 |
| 2015 | $5,592 | $326,498 | $88,719 | $237,779 |
| 2014 | $5,545 | $320,104 | $86,982 | $233,122 |
Source: Public Records
Map
Nearby Homes
- 3273 Cantona Paseo
- 6179 Cedar Creek Rd
- 5840 Redhaven St
- 3137 E Chip Smith Way
- 3109 E Chip Smith Way
- 3249 E Butterfly Ln
- 13873 La Pradera Way
- 5016 S Centennial Cir
- 13893 La Pradera Way
- 4758 S Solstice Ave
- 5822 Meeker Dr
- 2920 E Arbor Ln
- 6043 Rosewood Way
- 5961 Silveira St
- 4736 S Solstice Ave
- 13044 Bramble St
- 4729 S Aurora Ave
- 4723 S Aurora Ave
- 13078 Irisbend Ave
- 4726 S Solstice Ave
- 5989 Maycrest Ave
- 5969 Maycrest Ave
- 5978 Milana Dr
- 5968 Milana Dr
- 5988 Milana Dr
- 5999 Maycrest Ave
- 5959 Maycrest Ave
- 5976 Maycrest Ave
- 5958 Milana Dr
- 5986 Maycrest Ave
- 5998 Milana Dr
- 5956 Maycrest Ave
- 6009 Maycrest Ave
- 5996 Maycrest Ave
- 5948 Milana Dr
- 5949 Maycrest Ave
- 6008 Milana Dr
- 5946 Maycrest Ave
- 5967 Golden Nectar Ct
- 6006 Maycrest Ave