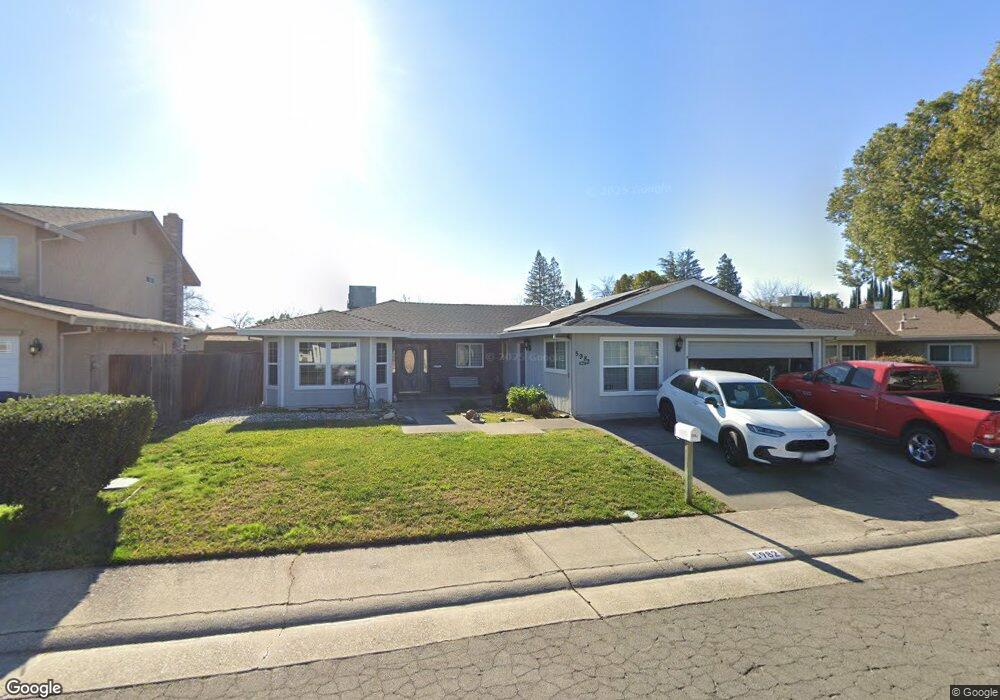
5982 Camray Cir Carmichael, CA 95608
Estimated Value: $572,000 - $627,861
4
Beds
3
Baths
2,075
Sq Ft
$293/Sq Ft
Est. Value
About This Home
This home is located at 5982 Camray Cir, Carmichael, CA 95608 and is currently estimated at $608,215, approximately $293 per square foot. 5982 Camray Cir is a home located in Sacramento County with nearby schools including Thomas Kelly Elementary School, John Barrett Middle School, and Del Campo High School.
Ownership History
Date
Name
Owned For
Owner Type
Purchase Details
Closed on
Mar 25, 2024
Sold by
Unknown
Bought by
Bomberry Andrew
Current Estimated Value
Home Financials for this Owner
Home Financials are based on the most recent Mortgage that was taken out on this home.
Original Mortgage
$74,000
Outstanding Balance
$72,731
Interest Rate
6.77%
Mortgage Type
New Conventional
Estimated Equity
$535,484
Purchase Details
Closed on
Apr 27, 2006
Sold by
Union Safe Deposit Bank
Bought by
Bomberry Andrew
Purchase Details
Closed on
May 30, 2002
Sold by
Craig D B and Estate Of Andrew Bomberry
Bought by
Union Safe Deposit Bank and Estate Of Andrew Bomberry
Purchase Details
Closed on
Nov 30, 1998
Sold by
Kunz Robert W and Kunz Brenda S
Bought by
Craig D B and Estate Of Andrew Bomberry
Purchase Details
Closed on
May 19, 1997
Sold by
Kunz Robert W and Kunz Brenda S
Bought by
Kunz Robert W and Kunz Brenda S
Create a Home Valuation Report for This Property
The Home Valuation Report is an in-depth analysis detailing your home's value as well as a comparison with similar homes in the area
Home Values in the Area
Average Home Value in this Area
Purchase History
| Date | Buyer | Sale Price | Title Company |
|---|---|---|---|
| Bomberry Andrew | -- | Fidelity National Title Compan | |
| Bomberry Andrew | -- | Fidelity National Title Compan | |
| Bomberry Andrew | -- | Fidelity National Title Compan | |
| Bomberry Andrew | -- | Accommodation | |
| Union Safe Deposit Bank | -- | -- | |
| Craig D B | $177,000 | Stewart Title | |
| Kunz Robert W | -- | -- |
Source: Public Records
Mortgage History
| Date | Status | Borrower | Loan Amount |
|---|---|---|---|
| Open | Bomberry Andrew | $74,000 | |
| Closed | Bomberry Andrew | $74,000 |
Source: Public Records
Tax History
| Year | Tax Paid | Tax Assessment Tax Assessment Total Assessment is a certain percentage of the fair market value that is determined by local assessors to be the total taxable value of land and additions on the property. | Land | Improvement |
|---|---|---|---|---|
| 2025 | $4,106 | $344,824 | $101,887 | $242,937 |
| 2024 | $4,106 | $338,064 | $99,890 | $238,174 |
| 2023 | $4,041 | $331,436 | $97,932 | $233,504 |
| 2022 | $3,961 | $324,938 | $96,012 | $228,926 |
| 2021 | $3,896 | $318,568 | $94,130 | $224,438 |
| 2020 | $3,823 | $315,302 | $93,165 | $222,137 |
| 2019 | $3,747 | $309,121 | $91,339 | $217,782 |
| 2018 | $3,704 | $303,061 | $89,549 | $213,512 |
| 2017 | $3,668 | $297,120 | $87,794 | $209,326 |
| 2016 | $3,427 | $291,295 | $86,073 | $205,222 |
| 2015 | $3,413 | $286,921 | $84,781 | $202,140 |
| 2014 | $3,344 | $281,302 | $83,121 | $198,181 |
Source: Public Records
Map
Nearby Homes
- 5812 Kimberly Hill Ct
- 4448 Hackberry Ln
- 5725 Misty Wind Ct
- 6141 Lincoln Ave
- 4132 Empire Way
- 4660 Lue Ln
- 6395 Perrin Way
- 5622 Cypress Ave
- 5500 Stately Oak Ln
- 5940 Rye Way
- 6008 Rye Way
- 6410 Rolling Way
- 4823 Schuyler Dr
- 5531 Cypress Ave
- 5908 Bourbon Dr
- 5904 Bourbon Dr
- 5424 Valhalla Dr
- 5637 Kiva Dr
- 3905 Apple Blossom Way
- 4904 Manzanita Ave
- 5986 Camray Cir
- 5978 Camray Cir
- 5904 Camray Cir
- 5900 Camray Cir
- 5974 Camray Cir
- 5908 Camray Cir
- 5985 Camray Cir
- 5989 Camray Cir
- 5912 Camray Cir
- 5993 Camray Cir
- 5970 Camray Cir
- 5977 Camray Cir
- 5916 Camray Cir
- 5973 Camray Cir
- 5905 Camray Cir
- 5966 Camray Cir
- 5901 Camray Cir
- 5909 Camray Cir
- 5920 Camray Cir
Your Personal Tour Guide
Ask me questions while you tour the home.