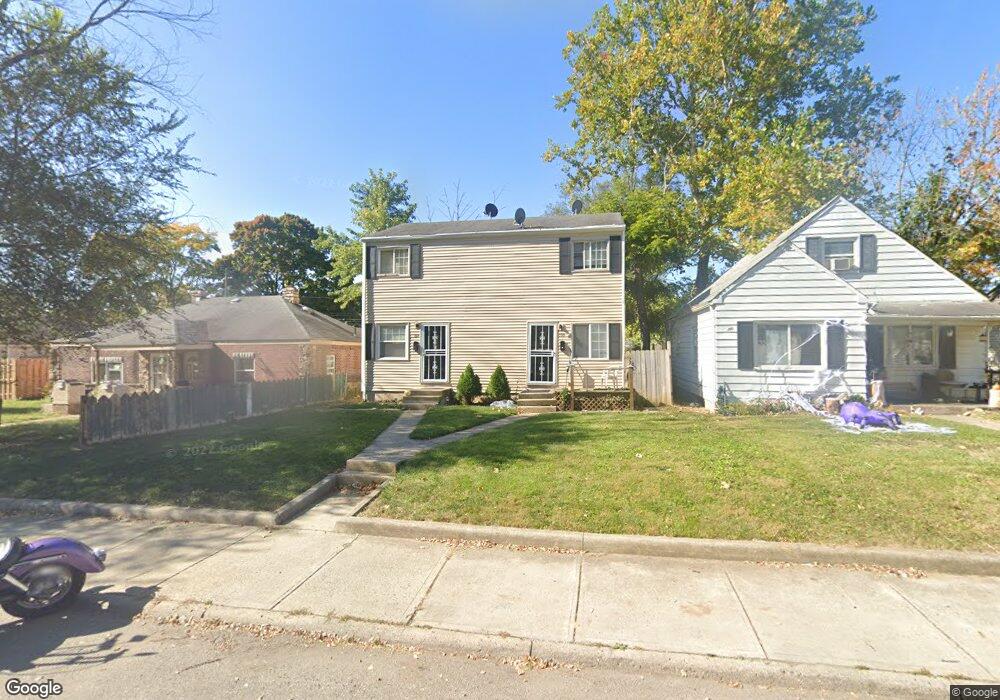
599-601 S Wheatland Ave Unit 2 Columbus, OH 43204
South Central Hilltop NeighborhoodEstimated Value: $121,000 - $173,000
4
Beds
2
Baths
1,560
Sq Ft
$95/Sq Ft
Est. Value
About This Home
This home is located at 599-601 S Wheatland Ave Unit 2, Columbus, OH 43204 and is currently estimated at $148,701, approximately $95 per square foot. 599-601 S Wheatland Ave Unit 2 is a home located in Franklin County with nearby schools including Lindbergh Elementary School, Hilltonia Middle School, and Briggs High School.
Ownership History
Date
Name
Owned For
Owner Type
Purchase Details
Closed on
Jul 1, 2016
Sold by
Mccrater Ronsrea
Bought by
Mc Cruter Investment Group
Current Estimated Value
Purchase Details
Closed on
Nov 9, 2010
Sold by
Fannie Mae
Bought by
Mccruter Rondrea L
Purchase Details
Closed on
Sep 21, 2010
Sold by
Oburu Peter H and Wanyandeh Charles J
Bought by
Federal National Mortgage Association
Purchase Details
Closed on
Jul 5, 2004
Sold by
Wanyandeh Charles and Oburu Peter H
Bought by
Wheatland Llc
Purchase Details
Closed on
May 4, 2004
Sold by
Oeurn Oeurp and Oeurn Channy
Bought by
Wanyandeh Charles and Oburu Peter H
Home Financials for this Owner
Home Financials are based on the most recent Mortgage that was taken out on this home.
Original Mortgage
$55,250
Interest Rate
5.91%
Mortgage Type
Purchase Money Mortgage
Purchase Details
Closed on
Mar 1, 1998
Sold by
Savoeung Oeurn
Bought by
Oeurn Oeurp
Purchase Details
Closed on
Mar 1, 1986
Create a Home Valuation Report for This Property
The Home Valuation Report is an in-depth analysis detailing your home's value as well as a comparison with similar homes in the area
Home Values in the Area
Average Home Value in this Area
Purchase History
| Date | Buyer | Sale Price | Title Company |
|---|---|---|---|
| Mc Cruter Investment Group | -- | None Available | |
| Mccruter Rondrea L | $18,000 | Accutitle Agency Inc | |
| Federal National Mortgage Association | $32,000 | None Available | |
| Wheatland Llc | -- | -- | |
| Wanyandeh Charles | $65,000 | Multiple | |
| Oeurn Oeurp | -- | -- | |
| -- | $38,000 | -- |
Source: Public Records
Mortgage History
| Date | Status | Borrower | Loan Amount |
|---|---|---|---|
| Previous Owner | Wanyandeh Charles | $55,250 |
Source: Public Records
Tax History Compared to Growth
Tax History
| Year | Tax Paid | Tax Assessment Tax Assessment Total Assessment is a certain percentage of the fair market value that is determined by local assessors to be the total taxable value of land and additions on the property. | Land | Improvement |
|---|---|---|---|---|
| 2024 | $2,625 | $38,330 | $5,220 | $33,110 |
| 2023 | $1,735 | $38,325 | $5,215 | $33,110 |
| 2022 | $1,056 | $19,880 | $2,800 | $17,080 |
| 2021 | $1,058 | $19,880 | $2,800 | $17,080 |
| 2020 | $1,060 | $19,880 | $2,800 | $17,080 |
| 2019 | $1,032 | $16,600 | $2,350 | $14,250 |
| 2018 | $1,005 | $16,600 | $2,350 | $14,250 |
| 2017 | $1,082 | $16,600 | $2,350 | $14,250 |
| 2016 | $1,020 | $15,020 | $3,360 | $11,660 |
| 2015 | $979 | $15,020 | $3,360 | $11,660 |
| 2014 | $931 | $15,020 | $3,360 | $11,660 |
| 2013 | $541 | $17,675 | $3,955 | $13,720 |
Source: Public Records
Map
Nearby Homes
- 558 S Oakley Ave Unit 60
- 667 S Oakley Ave
- 2247 Safford Ave
- 693 S Wayne Ave
- 729 S Wayne Ave
- 2190-2192 Safford Ave
- 724 S Eureka Ave
- 2169 Amherst Ave
- 651 S Terrace Ave
- 611 Whitethorne Ave
- 595 S Terrace Ave
- 2205-2207 Sullivant Ave
- 599 Whitethorne Ave
- 674 S Richardson Ave
- 453 S Eureka Ave
- 426 S Eureka Ave
- 378 S Wheatland Ave
- 762 S Terrace Ave
- 540 S Richardson Ave
- 471 S Terrace Ave Unit 473
- 599 S Wheatland Ave Unit 601
- 599-601 S Wheatland Ave
- 595 S Wheatland Ave
- 603 S Wheatland Ave Unit 605
- 603-605 S Wheatland Ave
- 591 S Wheatland Ave
- 609 S Wheatland Ave Unit 611
- 585 S Wheatland Ave
- 615 S Wheatland Ave Unit 617
- 608 S Oakley Ave
- 602 S Oakley Ave
- 581 S Wheatland Ave
- 598 S Oakley Ave
- 600 S Wheatland Ave
- 614 S Oakley Ave
- 618 S Oakley Ave
- 590 S Wheatland Ave
- 606 S Wheatland Ave
- 592 S Oakley Ave
- 588 S Wheatland Ave Unit 590